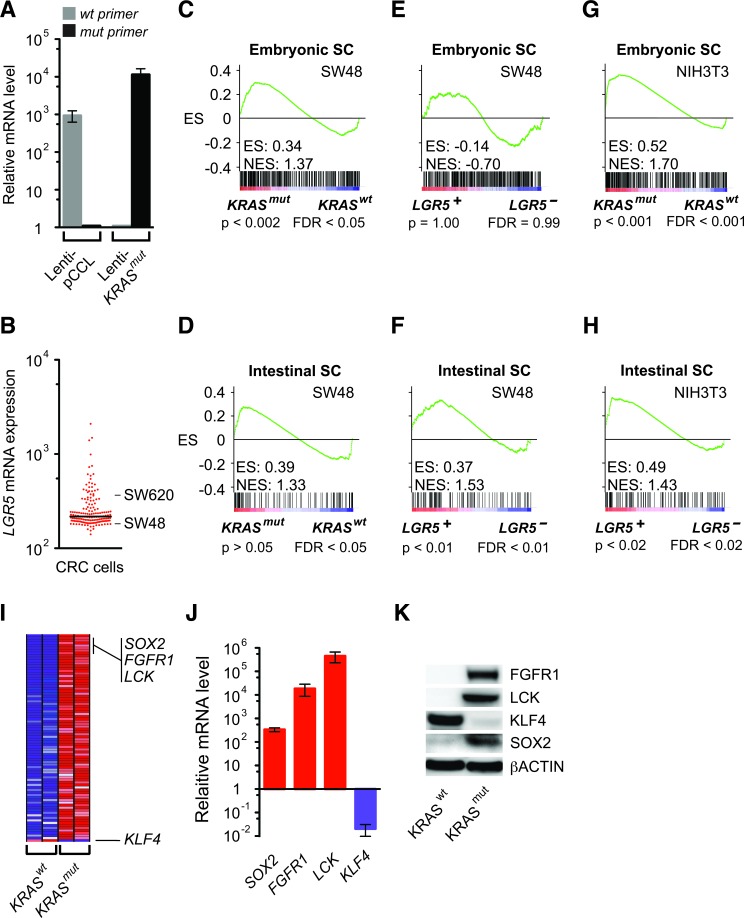
Figure 2. Activation of the embryonic SC-like and intestinal SC programs by KRASmut and LGR5.
A. Relative KRAS mRNA levels as measured by quantitative RT-PCR analysis using specific KRASwt and KRASmut primers in SW48 cells transduced with lenti-pCCL vector control or lenti-KRASmut. B. Relative LGR5 mRNA levels based on the gene expression profiles of 155 human colorectal cancer cells (GEO GSE59857). C.-F. GSEA using the embryonic SC-like (C, E) and intestinal SC (D, F) signatures on SW48 cells expressing lenti-pCCL vector control compared to lenti-KRASmut (C, D) or lenti-LGR5 (E, F). G. and H. GSEA using the embryonic SC-like and intestinal SC signatures on NIH3T3 cells expressing lenti-pCCL vector control compared to lenti-KRASmut (G) or lenti-LGR5 (H). I. H, Heat map of top 80 GSEA leading edge genes and KLF4 in SW48 cells expressing lenti-KRASmut and lenti-pCCL control (KRASwt). Red, pink, light blue, and dark blue colors represent high, moderate, low, and lowest expression. I, Relative gene expression levels of SOX2, FGFR1, LCK and KLF4 in SW48 cells expressing lenti-pCCL control versus lenti-KRASmut as measured by quantitative RT-PCR analysis. J. Western blot of FGFR1, LCK, KLF4, SOX2 and βACTIN in SW48 cells expressing lenti-pCCL control versus lenti-KRASmut.

