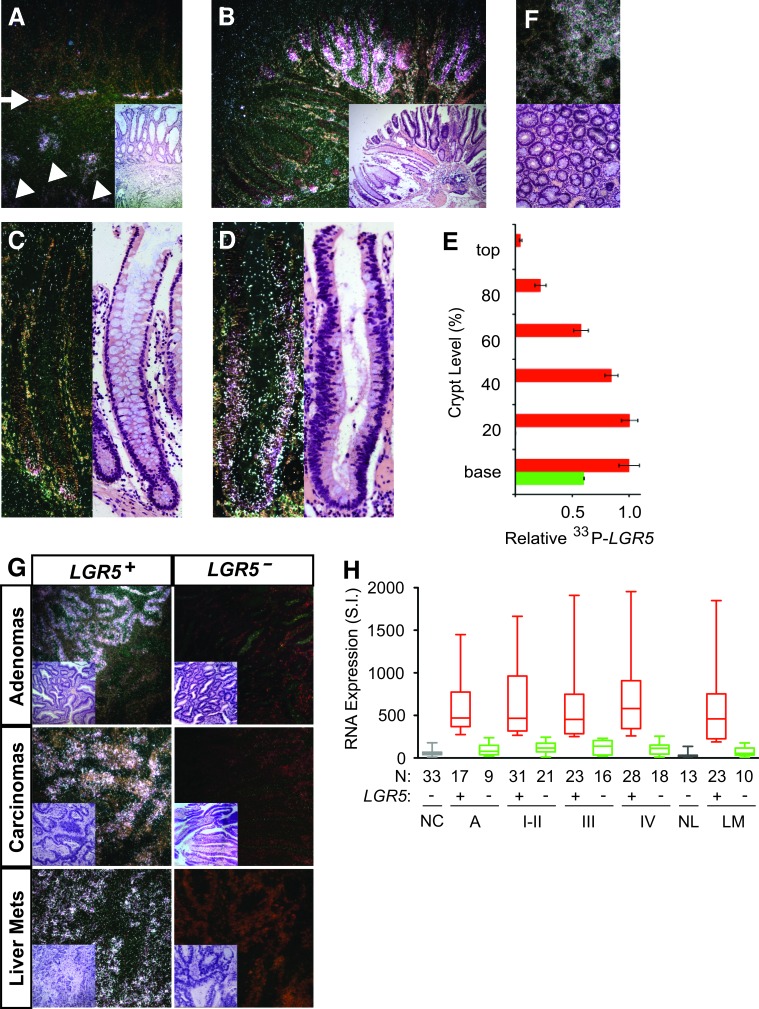
Figure 5. Spatiotemporal LGR5 expression in human colon cancer.
Representative dark field images of in situ hybridization with 33P-probe specific for human LGR5 mRNA and their corresponding H&E stainings in human colon adenomas and colon carcinomas. A. LGR5 mRNA expression in invading colon cancer cells (white arrowhead) and the adjacent hyperplastic crypt base stem cells (white arrow) of a primary colon carcinoma. B.-D. Representative LGR5 mRNA expression in hyperplastic (B, C) and aberrant (B, D) crypts of human colon adenomas. E. Relative LGR5 expression was quantified according to crypt level in 25 hyperplastic crypts (green bar) and 25 dysplastic crypts (red bar) of human colon adenomas. F. Axial cross-sections of dysplastic crypts of a human adenoma showed crypt clustered LGR5 expression. G. Representative dark field images of in situ hybridization with 33P-probe specific for human LGR5 mRNA in colon adenomas, primary colon carcinomas, and colon liver metastases (H&E inset). H. Turkey-whisker plot of LGR5 gene expression in human mucosal tissues of normal colon (NC), colon adenomas (Ad), colon primary carcinomas (I-IV), normal liver (NL), and colon metastases to the liver and lung (LM). Patient numbers (N) are as indicated.

