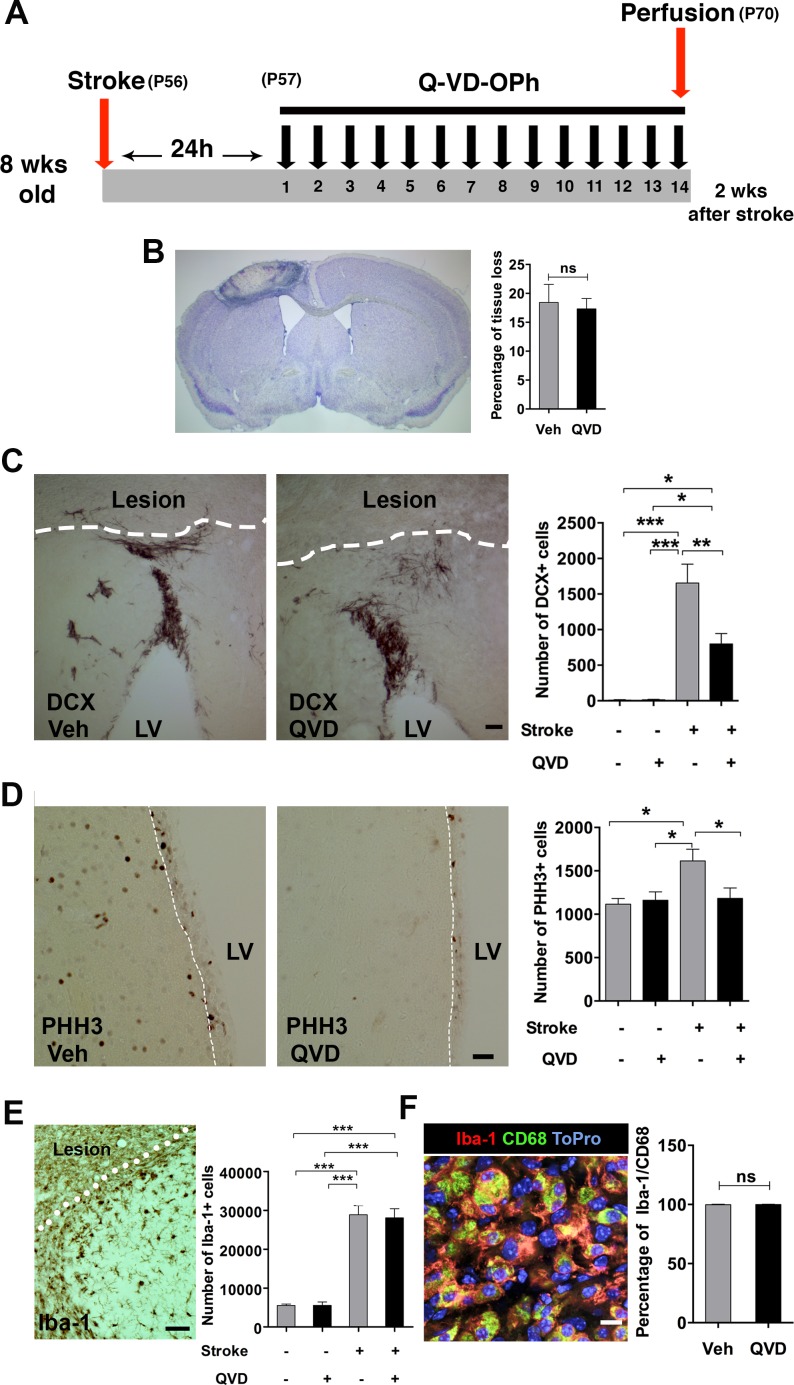
Figure 3. The short-term effect of Q-VD-OPh on the NSPC response after stroke.
A. The experimental design, where Q-VD-OPh (QVD) or vehicle were administered 24h after induction of stroke and continued for 2 weeks. P = Postnatal day B. Measurement of tissue loss after ischemia. Nissl staining was performed (the image) and the percentage of tissue loss in ischemic animals was calculated (bar graph). C Quantification of the DCX+ cells in the injured cortex after 2 weeks. The images show the DCX+ migrating cells in the peri-infarct cortex of the treatment groups, and the bar graph shows the quantification data. *P = 0.013, **P = 0.005, ***P < 0.0001. D. Analysis of proliferation in the SVZ at 2 weeks. The images represent PHH3 staining in the SVZ (indicated by a white dashed line) of ischemic animals from the two treatment groups, and the bar graph shows the quantification data. *P = 0.01. E. Analysis of Iba-1+ cells in the peri-infarct cortex at 2 weeks. ***P < 0.0001 F. Assessment of microglial activation in the peri-infarct cortex after 2 weeks. The confocal image shows CD68 expression (green) in Iba-1+ cells (red). Blue is the nuclear staining ToPro. The bar graph shows the percentage of coexpression of Iba-1 and CD68. Data are presented as mean ± SEM. LV = Lateral ventricle; ns = not significant. Scale bar = 100 μm in C., 50 μm in D. and E., and 10 μm in F.. n = 4 for sham controls, and n = 7 for each of the ischemia groups (Q-VD-OPh and vehicle).

