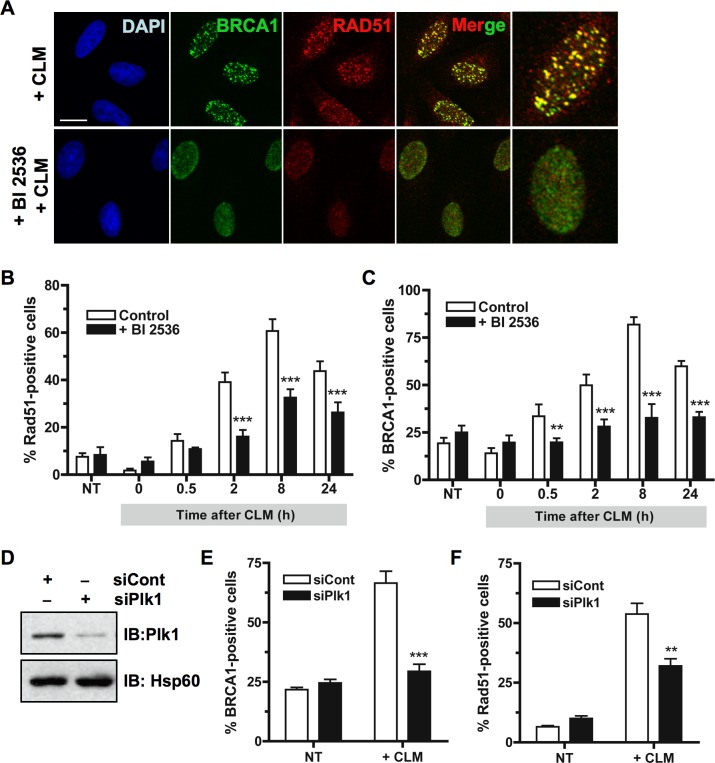
Figure 2. Inhibition of Plk1 impairs BRCA1 foci formation following DNA damage.
A. BRCA1 foci formation induced by DNA damaging treatment is impaired when Plk1 is inhibited. HeLa cells were pre-treated or not for 2 h with BI2536 and then treated with calicheamicin (CLM) for 1 h or left untreated, washed and collected at different time-points following treatment to perform immunofluorescence assay. Cells were immunostained with anti-BRCA1 and anti-Rad51 antibodies, probed with DAPI and then examined by confocal fluorescence microscopy. Representative images of BRCA1 (green) and Rad51 (red) co-staining in control cells (+ CLM) or in BI2536-pretreated cells (+ BI2536; + CLM) 2 h after CLM treatment are shown. B. The number of Rad51 foci-positive cells is reduced when Plk1 is inhibited. The number of foci was quantified using ImageJ software (NIH). Graph shows the mean number of positive cells containing more than 5 foci Rad51 foci ± SE over 3 independent experiments, n ≥ 120 cells per time-point. Significant differences in Rad51-positive cells numbers were assessed using a two-tailed unpaired Student's t-test and are indicated by *** = p < 0.001. C. The number of BRCA1 foci-positive cells is reduced when Plk1 is inhibited. The number of foci was quantified using ImageJ software (NIH). Graph shows the mean number of positive cells containing more than 5 foci BRCA1 foci ± SE over 3 independent experiments, n ≥ 150 cells per time-point. Significant differences in BRCA1-positive cells numbers were assessed using a two-tailed unpaired Student's t-test and are indicated by ** = p < 0.01 and *** = p < 0.001. D. Downregulation of Plk1 by siRNA was analyzed in HeLa cells. 24 h after transfection with 10 nM control siRNA (siCont) or siRNA against Plk1 (siPlk1), whole-cell extracts were resolved by SDS-PAGE and immunoblotted using anti-Plk1 antibody. Equal loading was confirmed using anti-Hsp60 antibody. E. The number of BRCA1 foci-positive cells is reduced when Plk1 is downregulated. BRCA1 foci were examined 6 h following CLM treatment. The number of foci was quantified using ImageJ software (NIH). Graph shows the mean number of positive cells containing more than 5 BRCA1 foci ± SE over 3 independent experiments, n ≥ 120 cells per time-point. Significant differences in BRCA1-positive cells numbers were assessed using a two-tailed unpaired Student's t-test and are indicated by *** = p < 0.001. F. The number of Rad51 foci-positive cells is reduced when Plk1 is downregulated. Rad51 foci were examined 6 h following CLM treatment. The number of foci was quantified using ImageJ software (NIH). Graph shows the mean number of positive cells containing more than 5 Rad51 foci ± SE over 3 independent experiments, n ≥ 120 cells per time-point. Significant differences in Rad51-positive cells numbers were assessed using a two-tailed unpaired Student's t-test and are indicated by ** = p < 0.01.

