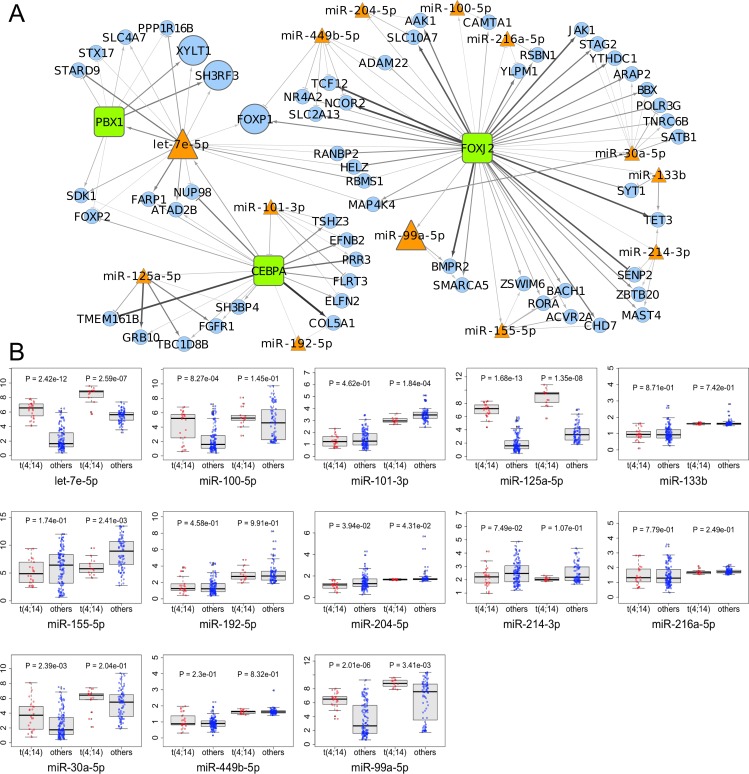
Figure 2. Transcriptional and post-transcriptional regulatory circuits in MM.
A. The network shows the eight nodes (bold-outlined larger shapes) included in relationships common to the networks obtained analyzing NewMM96 and MyIX153 datasets in parallel. Orange triangles represent microRNAs, green boxes Transcription Factors and light-blue circles the other coding mRNAs, while edges represent in-silico inferred relationships, with arrows and T-shaped edges showing respectively positive and negative correlations. Color intensities and edge widths are proportional to absolute correlation measures (where the relationship occurred in both datasets, the measure from the NewMM96 was chosen for edge attributes visualization). B. Boxplots show the expression levels of the miRNAs included in the network in the MyIX153 and the NewMM96 dataset. Red dots refer to t(4;14) patients, while blue ones represent non-t(4;14) patients expressions.

