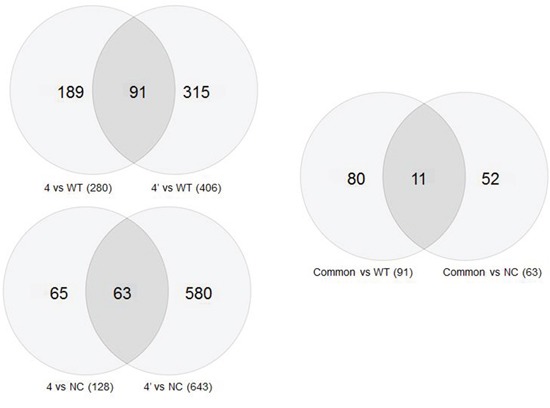
Figure 5. Venn circles representing gene expression of the various clones after BRCA1 silencing.

Comparisons of the number of genes whose expression is common to various samples in Venn diagrams. The upper left panel shows genes common to the wild type cells and cells in which the BRCA1 gene has been silenced, either for one month (4′) or for six months (4). The bottom Venn diagram symbolizes a similar comparison between gene expression in the negative control cells and the BRCA1 silenced cells. The right diagrams compares the upper and the lower diagrams.
