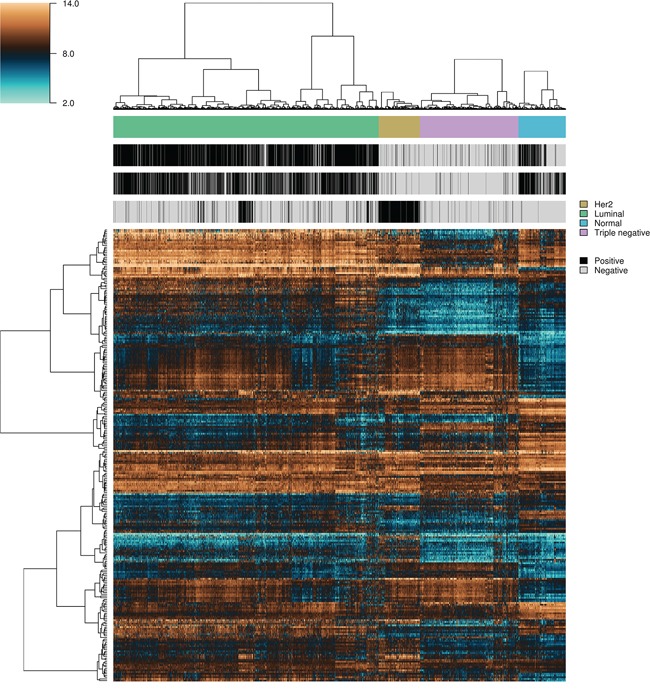
Figure 3. Heatmap and intra-class hierarchical clustering of 5,259 breast cancer and normal breast tissue samples.

Top and lower horizontal color bars show sample class and receptor status (ER, PR and HER2), respectively. The top gene dendrogram represents features used for the binary classification problems involving breast cancer against normal samples, and the lower gene dendrogram comprises features used for binary classification problems involving the different breast cancer molecular subtypes.
