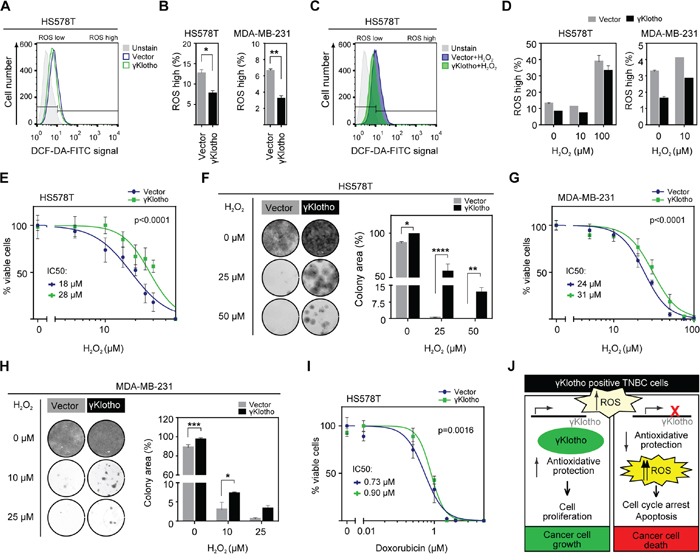
Figure 7. γKlotho protects cancer cells against ROS toxicity.

A. γKlotho overexpression reduces ROS levels in unstressed cells. Cells overexpressing control vector or γKlotho-Flag were seeded in 6 well plates, and harvested the next day. Before harvest, 10 μM DCF-DA was added to the cells, cells were incubated for 45 minutes at 37°C, then washed with PBS, trypsinized, and stained with PI before FACS analysis. Representative histograms are shown. B. Quantification of ROS positive live HS578T and MDA-MB-231 cells overexpressing control vector or γKlotho-Flag. Data are mean ± SD of 2 replicates. p ≤ 0.05, **p ≤ 0.01; t-test C. Control vector or γKlotho-Flag overexpressing cells were treated with 10 μM or 100 μM H2O2 when 10 μM DCF-DA was added to the cells. Staining and FACS analysis was performed as in A. Representative histograms are shown. D. Quantification of ROS positive live cells. Data are mean ± SD of 2 replicates. E. HS578T cells stably expressing vector or γKlotho-Flag were seeded in 96-well plates at 6500 cells/well. 12 hours later, culture media was replaced with increasing concentration of H2O2 in serum free RPMI media. 72 hours later MTS viability assay was performed. Data are normalized to the untreated controls (100% viability). Dose response curves are plotted using a non-linear regression model and IC50s were determined from the fitted curves using Hill equation. F. 100,000 HS578T cells expressing control vector or γKlotho were seeded in 12-well plates, next day treated with the indicated concentrations of H2O2 in serum free RPMI for 1 h at 37°C and then re-plated into 12-well plates at low density (2500 cells/well). Two weeks after plating, cells were fixed in ice-cold methanol and stained with crystal violet. Representative images of 2 independent experiments are shown. Cell growth was quantified by determining the percentage of area covered by crystal violet stained cell colonies. Data are presented as mean of three replicates ± SD from one of the experiments. *p ≤ 0.05, **p ≤ 0.01, ****p ≤ 0.0001; two way ANOVA. G. MDA-MB-231 cells stably expressing control vector or γKlotho-FLAG were seeded in 96-well plates at 8000 cells/well and cell viability after H202-induced oxidative stress measured as in E. H. 100,000 MDA-MB-231 cells expressing control vector or γKlotho were treated as in F, then re-plated in 12-well plates at 5000 cells/well. Cell growth was quantified and is presented as in F. *p ≤ 0.05, ***p ≤ 0.001; two way ANOVA. I. HS578T-vector and γKlotho-Flag cells were treated with increasing concentration of doxorubicin as in E. J. The working model of γKlotho role in triple negative breast cancer cells.
