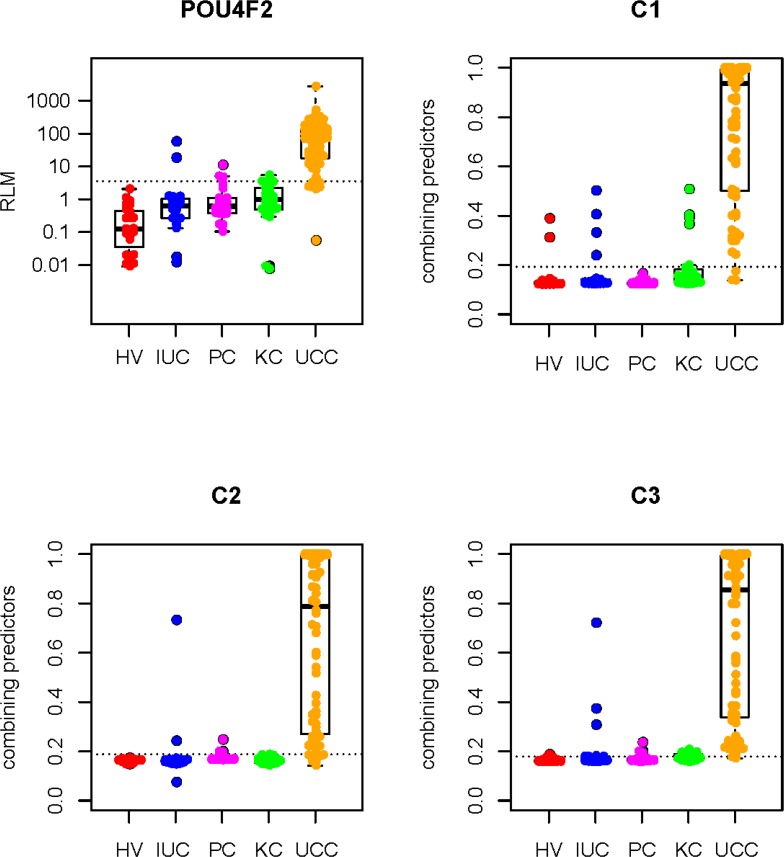
Figure 4. Scatter plots of RLM of POU4F2 and combining predicts of C1, C2, and C3 in the validation set.
For each scatter plot, the dotted line represents the best cutoff value; Mann-Whitney test was performed between UCC group and HV, IUC, PC, and KC group respectively, all the P values are lesser than 0.0001; HV: healthy volunteer, IUC: infected urinary calculi, PC: prostate cancer; KC: kidney cancer, UCC: urothelial cell carcinoma.

