
Figure 2. Intertumor genetic heterogeneity among the three primary tumors.
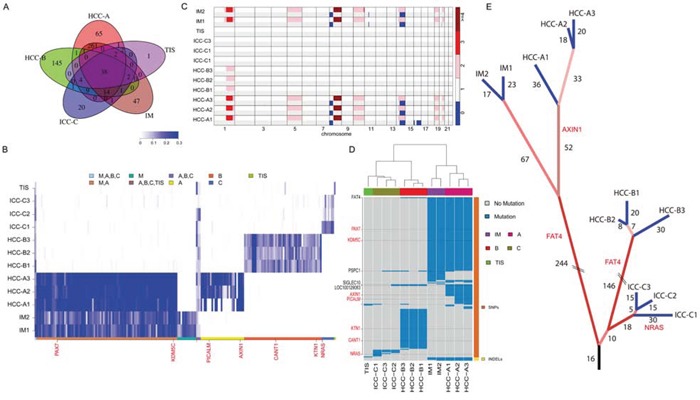
A. The Venn diagram of somatic mutations among the HCC-A, HCC-B, ICC and IM tumors. B. The VAF heatmap for the HCC-A, HCC-B, ICC, and IM tumors. VAFs of all non-synonymous SNVs with sequencing coverage above 10 across all samples were shown. The color keys correspond to mutations detected in different samples. C. The ASCNV of each sample. The two rows of each sample represent the copy numbers of the two alleles. D. The genes with nonsynonymous somatic mutations in the 12 different samples. Blue regions were mutations detected in a sample. The genes in red are known cancer-related genes. The clustering analysis was performed with the hierarchical clustering method. E. The phylogenetic tree constructed based on the somatic mutations detected with the in-house mutation detection method. The numbers indicate common somatic mutations shared by the tumors that were leafs of the branch. Mutations in the cirrhotic liver tissue provided a carcinogenic background, where three independent tumors occurred with profound intratumor heterogeneity.