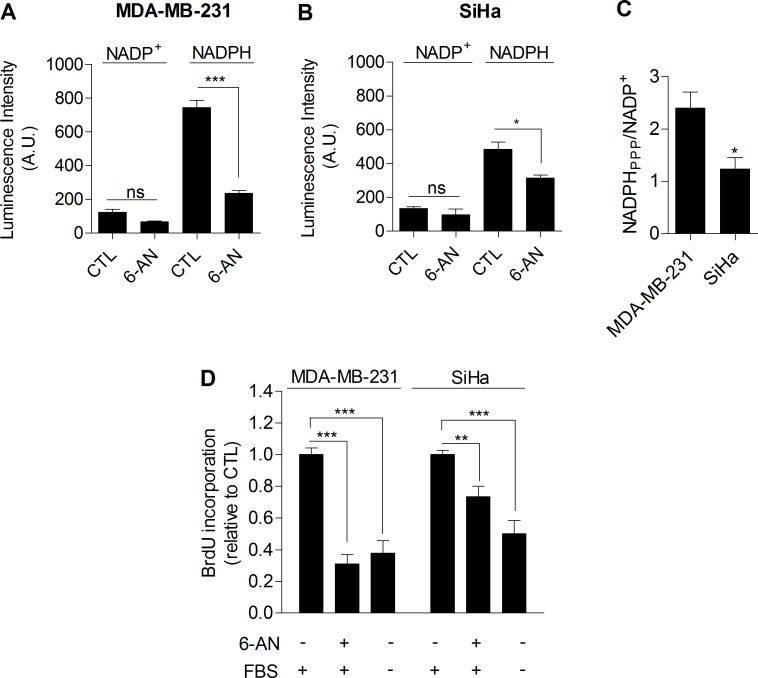
Figure 3. The PPP differentially supports proliferation in glycolytic and oxidative cancer cells.
Intracellular NADP+ and NADPH levels measured individually in viable glycolytic MDA-MB-231 A. and oxidative SiHa B. cancer cells. 6-aminonicotinamide (6-AN), a specific inhibitor of the PPP, was used (100 μM, 48 h treatment) to highlight NADPH production from the PPP (NADPHppp). C. NADPHPPP/NADP+ ratios in MDA-MB-231 and SiHa cancer cells. D. Proliferation measured by the incorporation of BrdU in MDA-MB-231 and SiHa cancer cells after exposure to 6-AN (100 μM, 48 h treatment). Medium containing no FBS was used as positive control in proliferation experiments. Two-sided t test A.-C. or one-way ANOVA with Bonferroni post-hoc test D.. *p < 0.05, **p < 0.01, ***p < 0.001, ns, not significant. Results are expressed as means ± SEM.

