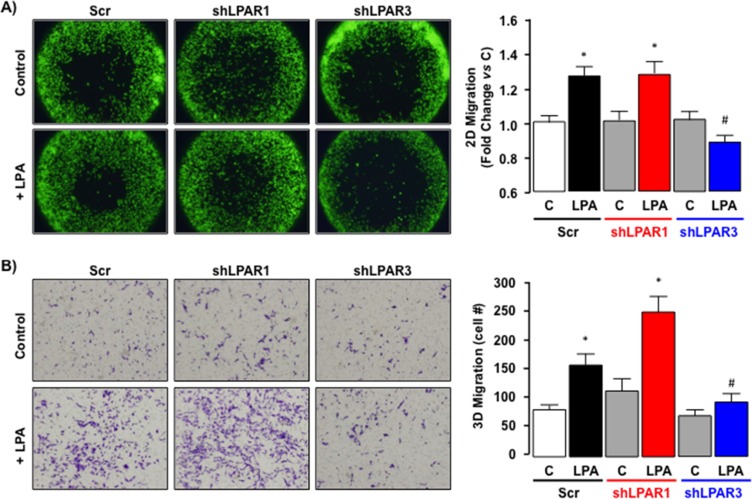
Figure 9. LPA-dependent migration signals via LPAR3 not LPAR1 in SKHep1 cells in vitro.
(A) Representative images of 2D cell migration for SKHep1 clones stably transfected with an off-target scrambled sequence (Scr) or an shRNA against LPAR1 (shLPAR1; data shown are for clone 8) or LPAR3 (shLPAR3; data shown are for clone 8) in the absence (Control (C)) or presence (+) of LPA (10 μM). Data from ≥ 2 independent clones repeated in 8 replicates were collected and expressed as fold change vs. pair-matched non-LPA-treated control (C). *p < 0.05 C vs. LPA, *p < 0.05 shLPAR3 + LPA vs. Scr + LPA and shLPAR1 + LPA. (B) Representative images of 3D cell migration for SKHep1 clones stably transfected with an off-target scrambled sequence (Scr) or an shRNA against LPAR1 (shLPAR1; data shown are for clone 11) or LPAR3 (shLPAR3; data shown are for clone 9) in the absence (Control (C)) or presence (+) of LPA (10 μM). Data from ≥ 2 independent clones repeated in triplicate were collected and expressed as change vs. pair-matched non-LPA-treated control (C) or Scrambled sequence non-LPA-treated control. *p < 0.05 C vs. LPA, *p < 0.05 shLPAR3 + LPA vs. Scr + LPA and shLPAR1 + LPA.

