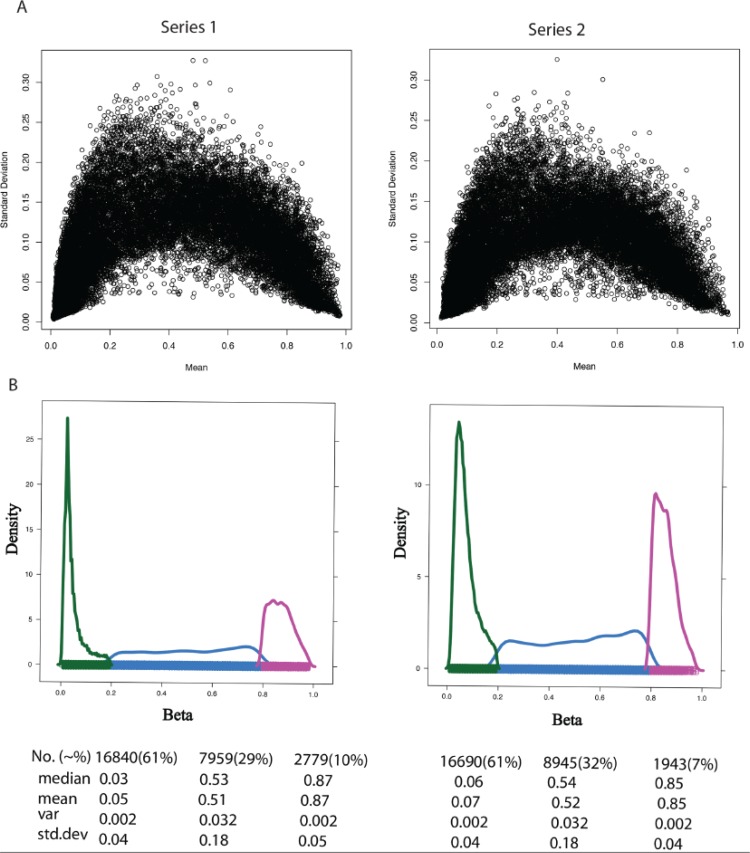
Figure 2. Variance measures with respect to mean β value across DNA methylation sample.
(A) The standard deviation (Y-Axis) and mean (X-axis) of β value for all samples in Series 1 (left) and Series 2 (right). (B) The properties of beta (β) value in the range of low [hypomethylated (UM), β-range 0 to 0.2, color green], medium [hemimethylated (HM), β-range 0.2 to 0.8, color blue], and high [hypermethylated (M), β-range 0.8 to 1.0, color purple] levels. Key statistical properties of the UM, HM, and M plots are highlighted below the figure. Table Abbreviations: No. represents Total number of CpGs in that range with percentage in bracket. Median, mean, var and std.dev represents median, mean, variation and standard deviation of CpG data in that range.

