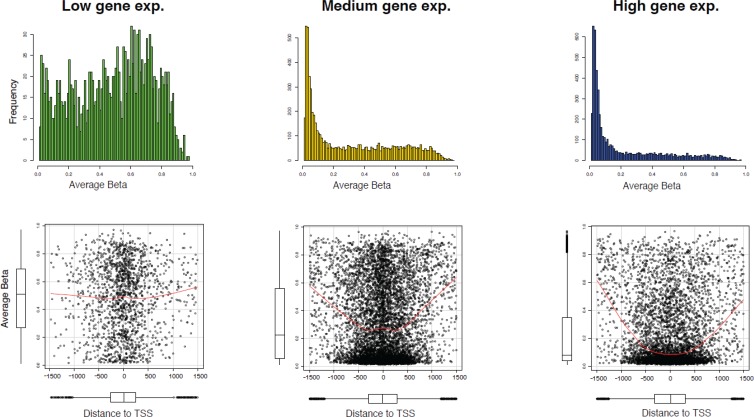
Figure 5. Association between DNA methylation and gene expression.
(A) Mean methylation levels according to three tertiles (low, medium, and high) of gene expression levels for 13,871 genes, identified by most variant mapping of Series 1 data. (B) Scatter plot of mean methylation levels in each gene expression tertile as a function of the distance from the transcription start site. The red line shows the smoothed curve. The distribution of average methylation values and data across the CpGs with respect to distance from transcription start site are visualized by boxplots.

