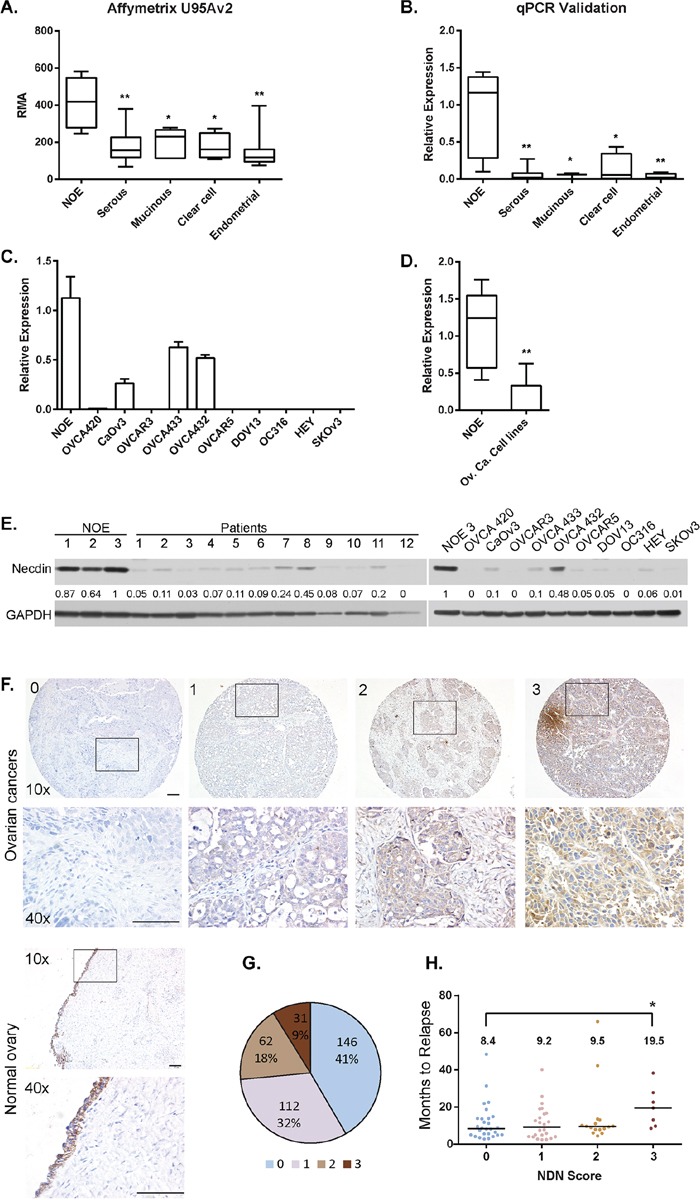
Figure 1. NDN expression is downregulated in ovarian cancers and cancer cell lines.

A. NDN mRNA expression in 35 ovarian cancers with different histotypes and 5 pools of normal ovarian epithelial scrapings (NOE) was profiled on Affymetrix U95Av2 array. B. Validation of microarray results using the same samples with qPCR. C. NDN expression levels were determined in NOE and 10 ovarian cancer cell lines using qPCR. D. Pooled NDN expression in 10 ovarian cancer cell lines. Data represent Mean ± S.D.. Asterisk denotes significant difference (* p < 0.05, ** p < 0.01) compared with NOE using a two-tailed student t test. E. Necdin levels in twelve high grade serous tumor samples and 10 cancer cell lines were measured by western blot analysis and compared to three normal ovarian epithelial samples. F. Normal ovaries and tumor tissue microarray with 351 interpretable cases were analyzed using immunohistochemistry with anti-necdin antibody and scored as 0 to 3. 4 examples from the tumor array representing the score 0 (no expression), 1 (low expression), 2 (moderate expression) and 3 (high expression) were shown with 10x magnification, and the insets were enlarged to 40x magnification. Bar is equal to 100 μm. F. The fraction of ovarian cancers with necdin expression. G. Correlation between disease free survival and necdin expression. Each circle represents one patient sample. The median disease free survival time was listed on top. Asterisk denotes significant difference (* p < 0.05) compared with 0 score.
