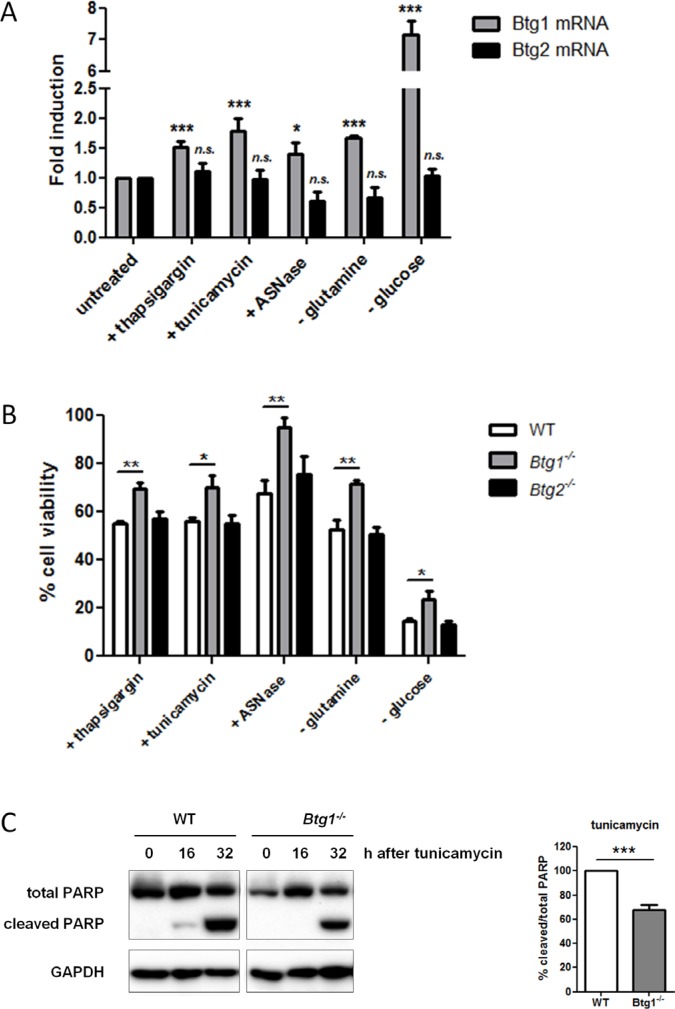
Figure 1. BTG1 affects cellular responses to stress.
(A) Btg1 mRNA is upregulated in response to various stress stimuli. WT MEFs were treated with various stressors and mRNA levels of Btg1 and Btg2 relative to untreated cells are shown. Bars represent average data from four independent experiments ± SEM. (B) BTG1, but not BTG2 expression, is required for survival under cellular stress conditions. WT, Btg1−/− and Btg2−/− MEFs were challenged with ER stress-inducing drugs (thapsigargin, tunicamycin), glucose depletion, and amino acid limitation (glutamine starvation, Asparaginase (ASNase)). Metabolic activity was determined by MTS assay and cell survival relative to untreated cells (set at 100%) is shown. Bars represent average data from four independent experiments ± SEM. (C) Loss of BTG1 protects cells from stress-induced apoptosis. WT and Btg1−/− MEFs were stressed with tunicamycin and apoptosis was measured by western blot for cleaved PARP protein. Bars represent average data from three independent experiments ± SEM. P-values are indicated with ***P < 0.001, **P < 0.01 and *P < 0.05 (two-tailed t-test).

