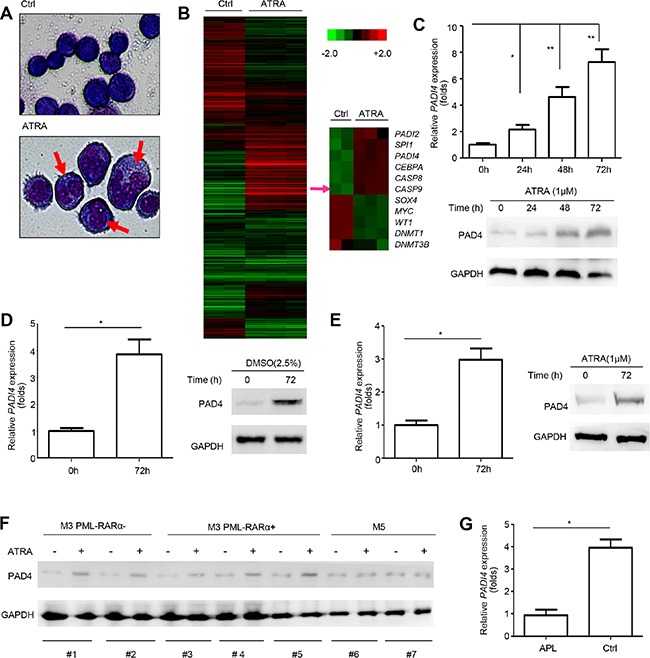
Figure 1. PAD4 expression increased during the differentiation of leukemia cells.

(A) Morphological changes of HL-60 cells after ATRA treatment. (B) The cluster heat map shows differently expressed mRNAs in HL-60 before and after ATRA-induced differentiation from microarray data (P < 0.05). (C) PAD4 expression was detected at mRNA (top) and protein (bottom) levels after ATRA (1 μM) treatment at various timepoints in HL-60 cells. GAPDH was used to normalize as the loading control. (D) PAD4 expression was also assayed in HL-60 cells after DMSO treatment for 72 h by qRT-PCR (left) and Western blot (right). (E) qRT-PCR and Western blot were performed to detect the PAD4 expression at mRNA (left) and protein (right) levels in NB4 cells after treatment with ATRA for 72 h. (F) The expression of PAD4 was detected by Western blot in clinical samples after ATRA treatment. (G) Expression of PAD4 was detected by qRT-PCR in clinical samples of APL (n = 12) and the normal controls (n = 8). *P < 0.05, **P < 0.01. Data are means of biological triplicates (± standard error) and representative of triplicate experiments.
