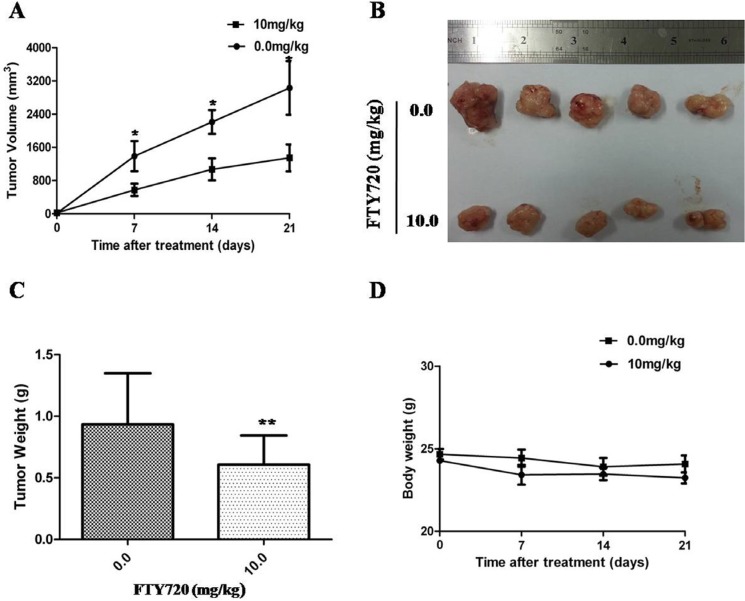
Figure 6. Inhibition of xenograft tumor growth by FTY720.
(A) Time course of tumor growth, measured as tumor volume in each group at the indicated time of treatment with vehicle control or FTY720 (10 mg/kg; ip.). Data are presented as mean ± SD; (B) Representative picture of tumor growth in mice treated with the indicated concentration of FTY720 and vehicle control; (C) The bar graph represents mean of the tumor weight from FTY720-treated and control mice. Data are presented as mean ± SD. **, P < 0.01; (D) Compared with control group, the mean body weight was not significantly change in FTY720-treated group.

