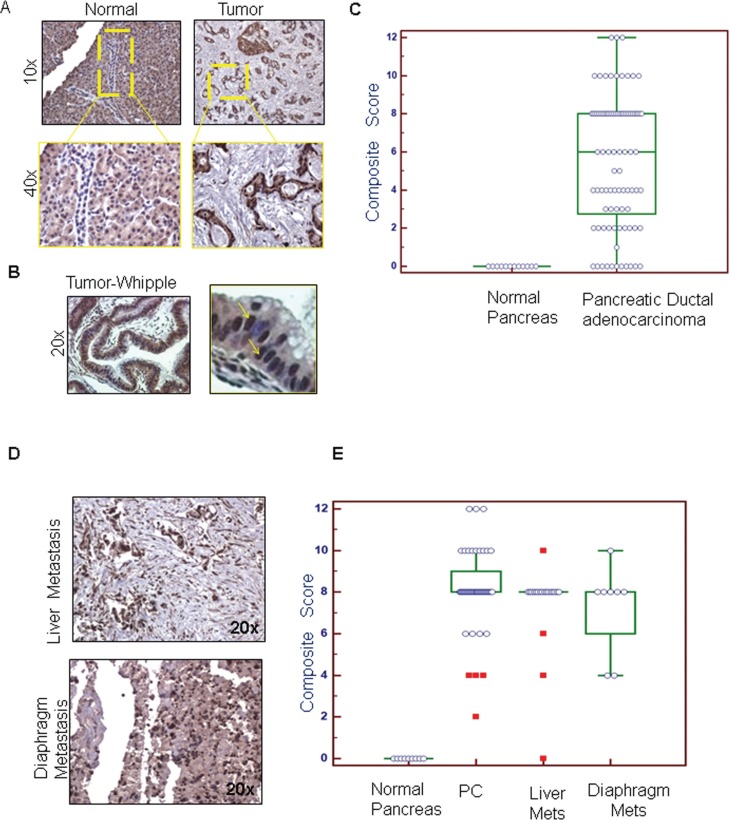
Figure 1. Immunohistochemical comparison of the expression of PD2 in normal pancreas, PDAC and metastatic tissues.
(A) The expression of PD2 was investigated in the normal and the PDAC tissues. PD2 expression was absent in the ducts of the normal pancreas whereas positive staining was observed in the pancreatic ductal adenocarcinoma (yellow box). There is a significant increase in the expression of PD2 in the PDAC tissues when compared to the normal pancreas. (B) The expression of PD2 was elevated in tissue samples obtained from patients who underwent Whipple procedure. The magnified image in the right panel indicates overexpression of PD2 in few cells. (C) The staining score and the intensity scores were multiplied to obtain the composite score which was subsequently represented as box plots. The box plot denotes the PD2 expression in the ductal region of PDAC tissue in X-axis and its composite score in Y-axis. (D) PD2 expression in the metastatic tissues was examined. (E) The staining score and the intensity score were multiplied to obtain the composite score which was represented in the box plots as shown in the bottom panel. The box plot denotes the total no. of spots in the primary and the metastatic tissues along with the composite scores on the y axis. Both the primary tissues (1A) as well as the metastatic tissues had significantly higher CS than the normal tissues.

