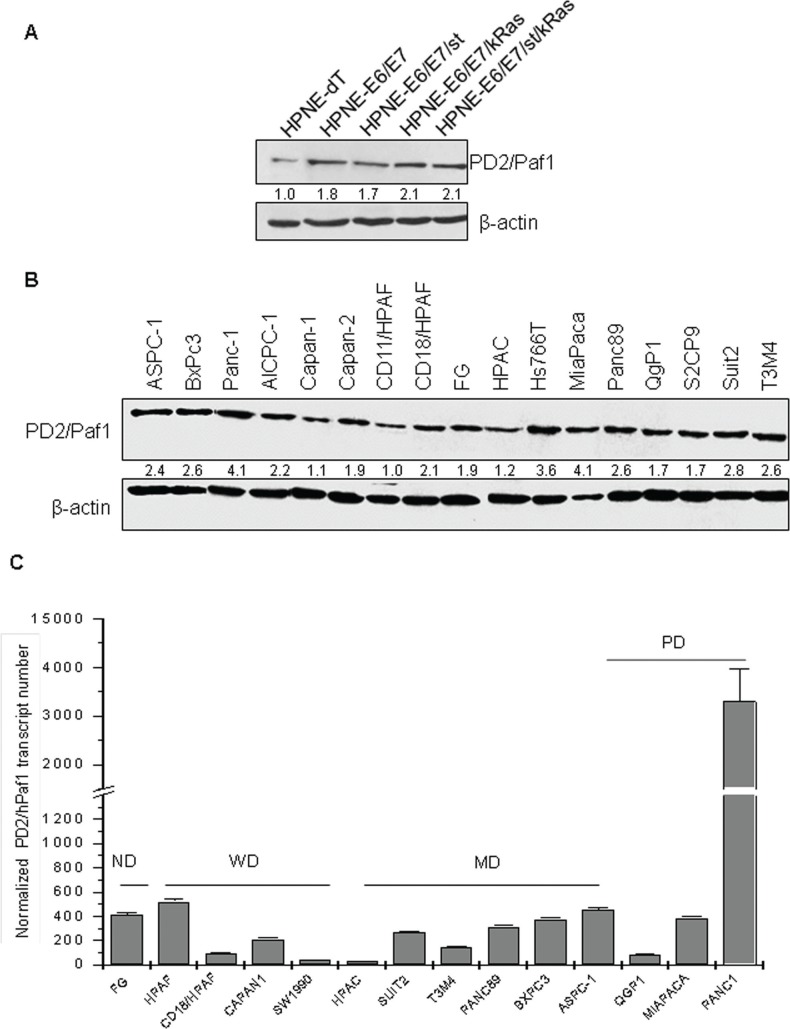
Figure 2. PD2 expression level in a panel of PDAC cell lines using western blot and real time PCR.
(A) Protein lysates from the HPNE progression model were resolved on a 10% SDS-PAGE gel. PD2 expression was observed in all the cell lines. The expression of PD2 was higher in the oncogenes transformed cell lines when compared to the parental HPNE. (B) Protein lysates from 17 PDAC cell lines were resolved on a 10% SDS-PAGE gel. The expression of PD2 was observed in all the cell lines when incubated with anti-PD2 antibody (upper panel). For loading control, membranes were stripped and re-probed with anti-β-actin (lower panel). PD2/hPaf1 presents a band of 80 kDa. (C) hPaf1 expression was analyzed by real time-PCR on 14 PDAC cell lines, SW1990, AsPC-1, Panc-89, T3M4, CD18/HPAF, Panc-1, MiaPaCa, Suit2, FG-Colo, Qgp1, HPAC, BxPC3, Capan-1, Capan-2. GAPDH expression was used as an internal reference. There is a 30-fold overexpression of PD2/hPaf1 in the poorly differentiated Panc-1 cell line, correlating with its gene amplification. MiaPaCa, another poorly differentiated cell line, and ASPC-1, a moderately to poorly differentiated cell line, showed moderate to high PD2/hPaf1 expression, thus indicating that PD2/hPaf1 is expressed at higher levels in poorly differentiated cells as compared to the well differentiated cells.

