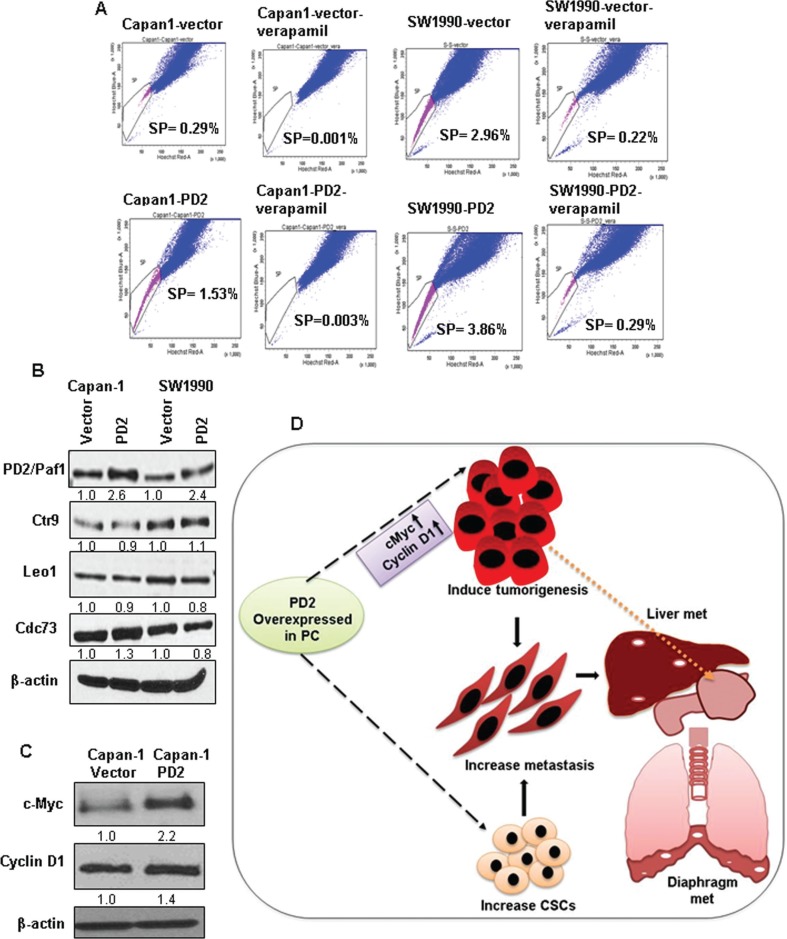
Figure 6. Effect of PD2 overexpression on the enrichment of SP/CSC population and on other PAF1 complex member proteins.
(A) FACS analysis shows a clear increase in the number of SP/CSC population in PD2 overexpressed cells when compared to control cells. A total of 0.29% and 2.96% SP population were observed in Capan-1 and SW1990 vector transfected cell line and 1.5% and 3.86% SP were observed in the PD2 transfected Capan-1 and SW1990 PDAC cells respectively. Verapamil treated cells served as a control for isolating SP cells and it shows a clear decrease in the SP cells (Capan-1-Vector-0.001%, Capan-1-PD2-0.003%, SW1990-Vector-0.216%, SW1990-PD2-0.287%). (B) The effect of PD2 overexpression was assessed on other PAF1 complex proteins. PD2 overexpression led to a moderate upregulation of Cdc73 in Capan-1-PD2 cells when compared to the control cells. However, there was no change in the expression of Ctr9 and Leo1. No difference was observed in the expression of PAF complex members in SW1990 cells. (C) The expression of c-Myc was found to be two fold upregulated in Capan-1-PD2 cells. However, SW1990 cells lacked the expression of c-Myc. Cyclin D1 was found to be upregulated in Capan-1. (D) Schematic representation of the effect of PD2 overexpression in PDAC on tumorigenesis and metastasis. PD2 overexpression results in increased growth of PDAC cells due to upregulation of c-Myc and cyclin D1 which led to increased tumor growth in the pancreas of the nude mice (as indicated by the spotted arrow). Overexpression of PD2 led to metastasis (indicated as the white spotted lesions) to distant organs including liver and diaphragm. Most importantly, the elevated expression of PD2 led to an increase in the CSC population when compared to the control cells.

