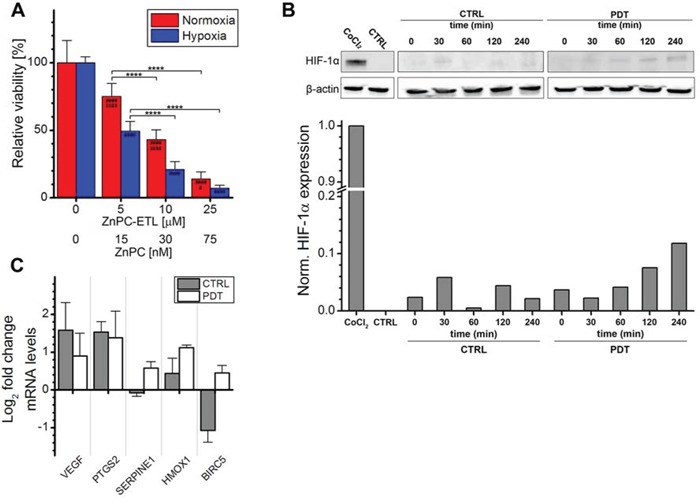
Figure 2. Analysis of HIF-1α activation after PDT.

A. SK-ChA-1 cells were incubated with increasing concentration of ZnPC-ETLs, treated with PDT, and maintained at normoxic (red bars) or hypoxic (blue bars) culture conditions. Cell viability was determined 24 hours post-PDT (n = 6 per group). B. SK-ChA-1 cells were treated with PDT (10 μM ZnPC-ETLs, final lipid concentration) or received a control (CTRL) treatment, after which the cells were placed in a hypoxic chamber up to 240 minutes (min) post-PDT. HIF-1α protein levels were determined using Western blotting. As a positive control, cells were incubated with 500 μM CoCl2 for 24 hours (top panel). Next, the HIF-1α protein bands and their corresponding β-actin protein bands were quantified using ImageJ software [74] and each HIF-1α value was divided by its corresponding β-actin value. All values were normalized to the positive control (CoCl2) (bottom panel). C. SK-ChA-1 cells were either left untreated (grey bars) or treated with PDT (white bars), and subsequently placed at hypoxic conditions for 4 hours. Thereafter, downstream targets of HIF-1 were analyzed with qRT-PCR (n = 3 per group). Readers are referred to the experimental section for the significance of the statistical symbols.
