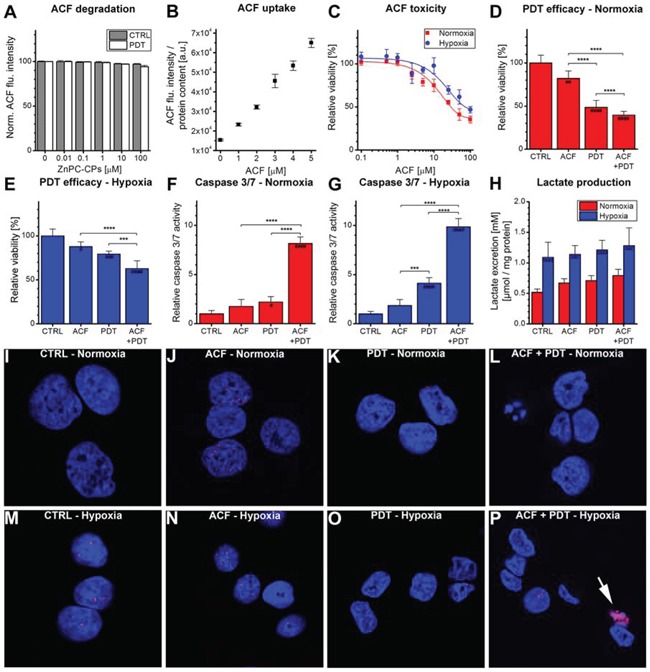
Figure 4. Combination treatment of ACF with PDT.

A. Evaluation of ACF stability using increasing concentrations of ZnPC-containing cell phantoms (ZnPC-CPs) with or without irradiation. ACF degradation was monitored using fluorescence spectroscopy (n = 4 per concentration). B. Cells were incubated with ACF for 24 hours, after which the uptake of ACF was determined using fluorescence spectroscopy. Data were normalized to protein content (n = 4 per concentration). C. ACF toxicity was determined after 24-hour incubation under either normoxic (red line) or hypoxic (blue line) conditions using the WST-1 method (n = 4 per group). Treatment efficacy of ACF and ACF + PDT was tested in SK-ChA-1 cells after 4 hours at D. normoxic and E. hypoxic culture conditions (n = 6 per group). (F, G) Relative caspase 3/7 activity was determined 4 hours after PDT at incubation at F. normoxic or G. hypoxic culture conditions (n = 6 per group). H. Lactate production by SK-ChA-1 cells treated with ACF and ACF + PDT was evaluated after 24 hours at normoxic (red bars) or hypoxic (blue bars) culture conditions (n = 6 per group). I–P. Analysis of DNA damage after control (CTRL), ACF, PDT, and ACF + PDT treatment. Cells were kept for 4 hours under normoxic (I-L) or hypoxic conditions (M-P) post-treatment. Cells were stained with DAPI (nuclei, blue) and phospho-H2AX (DNA double-strand breaks, red). The arrowhead in panel P indicates apoptosis. Readers are referred to the experimental section for the significance of the statistical symbols.
