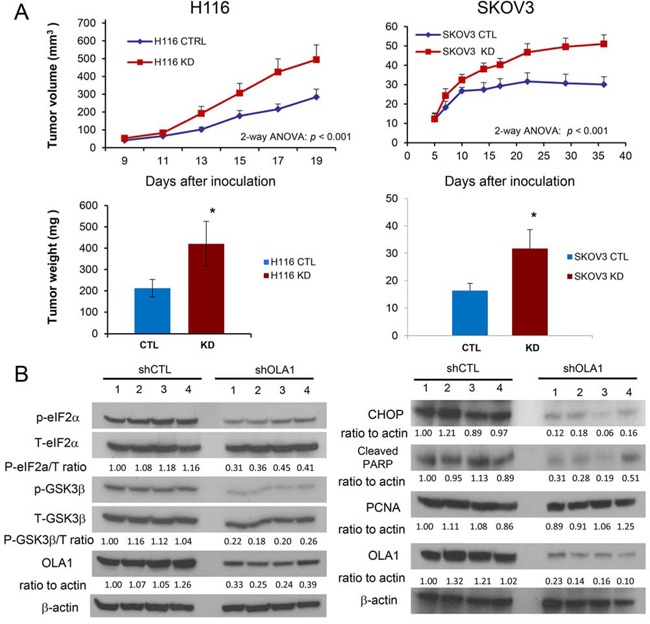
Figure 1. Knockdown of OLA1 promotes tumor growth in vivo.

Growth of xenograft tumors derived from H116 (left) and SKOV3 (right) cells stably transfected with control shRNA (CTRL) or OLA1 shRNA (KD). SCID mice were inoculated with the CTRL and KD cells on each side of their back, and the tumor growth was evaluated by measuring tumor sizes on the indicated days (top) and tumor weights (bottom) at the end of the experiment. Data are presented as mean ± SEM (n = 8/12 for H116/SKOV3 groups; **p < 0.001; two-way ANOVA). B. Immunoblot analysis of tumor tissues harvested from the xenograft models shown in A. Phosphorylation of eIF2α and GSK3β was assessed in the H116 tumors, and apoptotic and proliferative markers (CHOP, cleaved PARP, and PCNA) were evaluated in the SKOV3 model. For each blot, OLA1 was probed for verification of the knockdown, and β-actin for loading control; densitometric quantification was conducted using the NIH ImageJ software.
