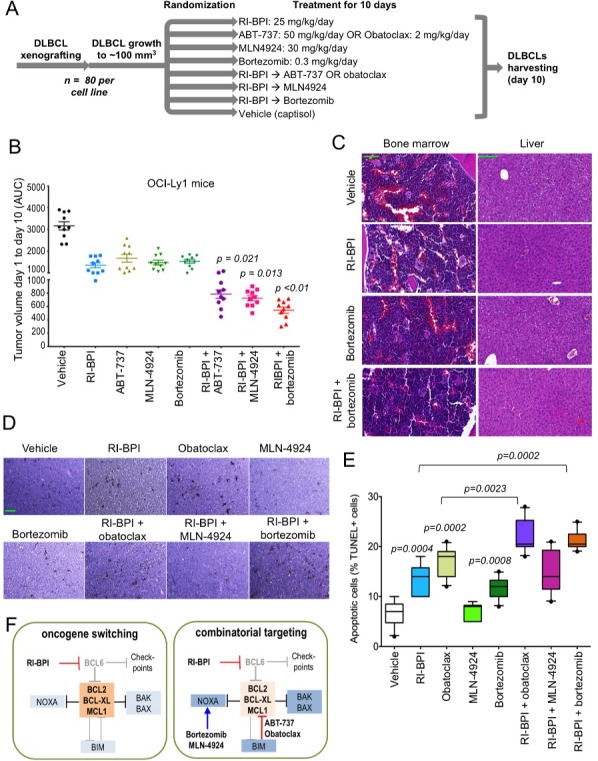
Figure 5. Targeting or pro-survival pathways increased the effect of RI-BPI in vivo.

A. Flowchart of GCB-DLBCL mice xenografting, treatment and end-point evaluation. B. Tumor volume represented by the area under the curve (AUC) of xenograft growth from day 1 to day 10 of treatment in OCI-Ly1 mice treated with the compounds shown in A. T-test significant p values of combinatorial regimens are shown (pair-wise comparisons vs. RI-BPI). C. Representative hematoxylin and eosin microphotographs of bone marrow and liver tissues from C57BL/6 mice treated with RI-BPI, bortezomib or their combination as in A. The green bar (vehicle) represents 100 micrometers D. Representative TUNEL histochemistry microphotographs from lymphoma tissues from the mice shown in B. The green bar (vehicle) represents 50 micrometers. E. Quantification of apoptotic cells (% of positive TUNEL nuclei over total nuclei) in OCI-Ly1 mice xenografted lymphoma tissues. Only statistically significant p values are depicted (T-test). F. Cartoon representation of the proposed oncogene switching mechanism and combinatorial targeting of BCL6 and BCL2 pathways in GCB-DLBCL.
