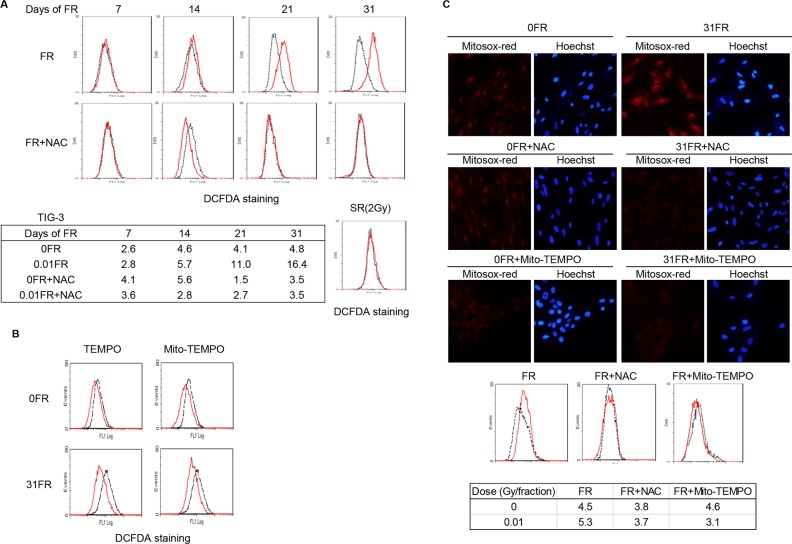
Figure 2. ROS generation in 0FR and 31FR cells.
A. FACS results for DCFDA staining in untreated (dotted black lines) and treated TIG-3 cells (red lines). Mean fluorescence intensity values of DCFDA staining were shown. B. FACS results for DCFDA staining in untreated 0FR and 31FR cells (dotted black lines) and TEMPO- or Mito-TEMPO-treated TIG-3 0FR and 31FR cells (red lines). C. Images of Mitosox-red staining cells in control 0FR and 31FR cells of TIG-3 with and without NAC or Mito-TEMPO treatment. Mean fluorescence intensity values of Mitosox-red staining were shown.

