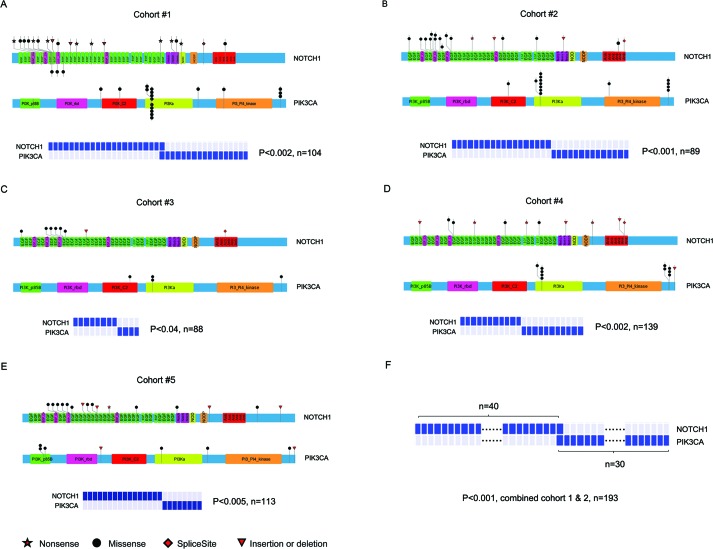
Figure 1. Exclusion between the mutations of NOTCH1 and PIK3CA in ESCC.
The location of somatic mutations on NOTCH1 and PIK3CA (upper panel) and correlation of these mutations (bottom panel) in cohort #1 A., cohort #2 B., cohort #3 C., cohort #4 D., cohort #5 E., and combined cohort #1 and #2 F.. The bottom symbols of NOTCH1 in Figure 1A represent novel mutations that were identified in our analysis according to the sites reported in catalogue of somatic mutations in cancer (COSMIC). The exclusivity of NOTCH1 and PIK3CA mutations was analyzed via modified model proposed by Ewa Szczurek. A P value of <0.05 was considered to be statistically significant.

