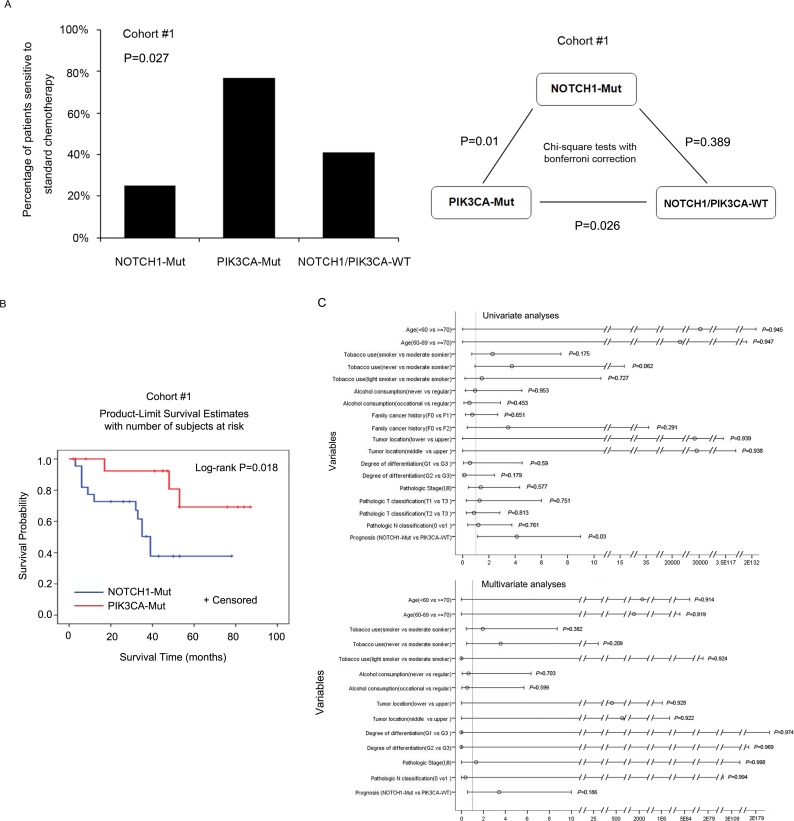
Figure 5. Chemotherapy response and mutation status of NOTCH1 and PIK3CA.
A. Left panel: The frequencies of the patients who exhibited sensitivity to standard chemotherapy are described in three groups: patients with NOTCH1 mutations, PIK3CA mutations, or patients with neither, in cohort #1. Right panel: chi-square test with Bonferroni correction was used to compare the chemotherapeutic efficacy of the subgroups in cohort #1. B. PFS of 29 patients with NOTCH1 or PIK3CA mutations in cohort #1. C. Cox regression analysis was used to examine the PFS.

