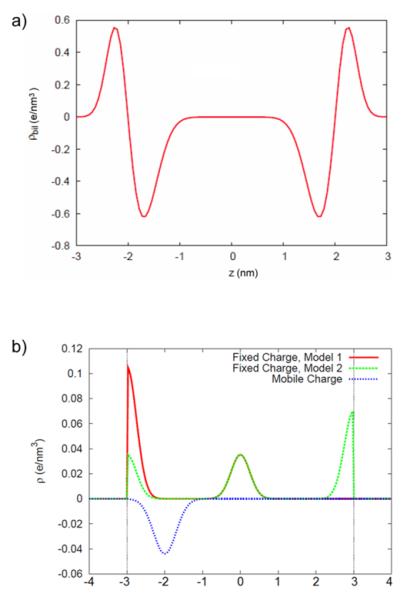
Fig. 2.
A) Charge density of the phospholipids charges as a function of the transmembrane coordinate z based on molecular dynamic simulations (-z towards the inside of the cell) and b) Density of prestin-associated charges, including the mobile (dark dashed line) and stationary charges based on models 1 (solid line) and 2 (light dashed line). Notice that two models have the same central charge (the corresponding lines overlap) and they differ toward the inner and outer boundaries of the membrane. The density representing the mobile charge has a central position at −2nm closer to the inner boundary of the membrane corresponding to the case of application of a depolarizing electric field.

