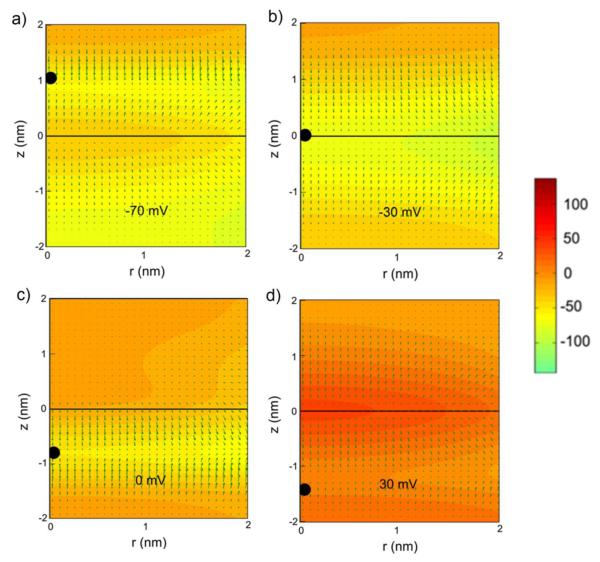
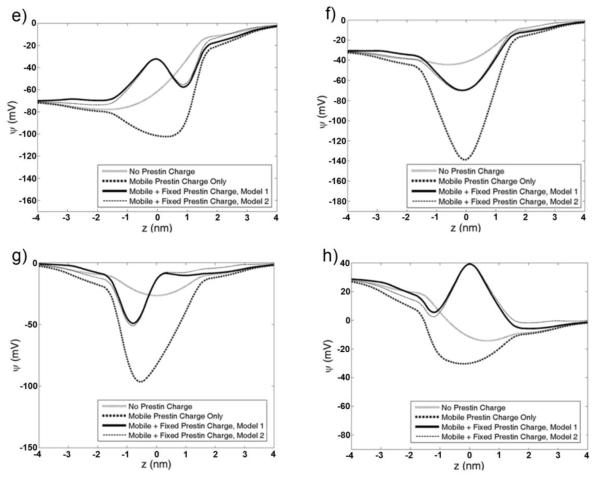
Fig. 3.
Electric potential and electric field inside and near prestin in the case of the applied DC-field. A-D) Two-dimensional (rz) plots of the potential in a central inside-prestin area of the membrane. The correspondence between the 2-D plotted potentials and their values are shown via the representative bar. The arrows show the direction and magnitude of the local electric field. The black bullet represents the average position of the mobile charge. DC-voltage is −70 (a), −30 (b), 0 (c), and 30 mV (d) and d. E-H) one-dimensional (along the central z-axis) distributions of the electric potential. The light solid line, dark dotted line, solid line, and thin dashed line correspond, respectively, to applied voltage and membrane charges with no prestin charges, mobile prestin charges included, all charges considered with prestin stationary charges determined according to model 1, and all charges considered with prestin stationary charges determined according to model 2. DC-voltage is −70, −30, 0, and 30 mV, respectively, in e, f, g, and h.


