Figure 1.
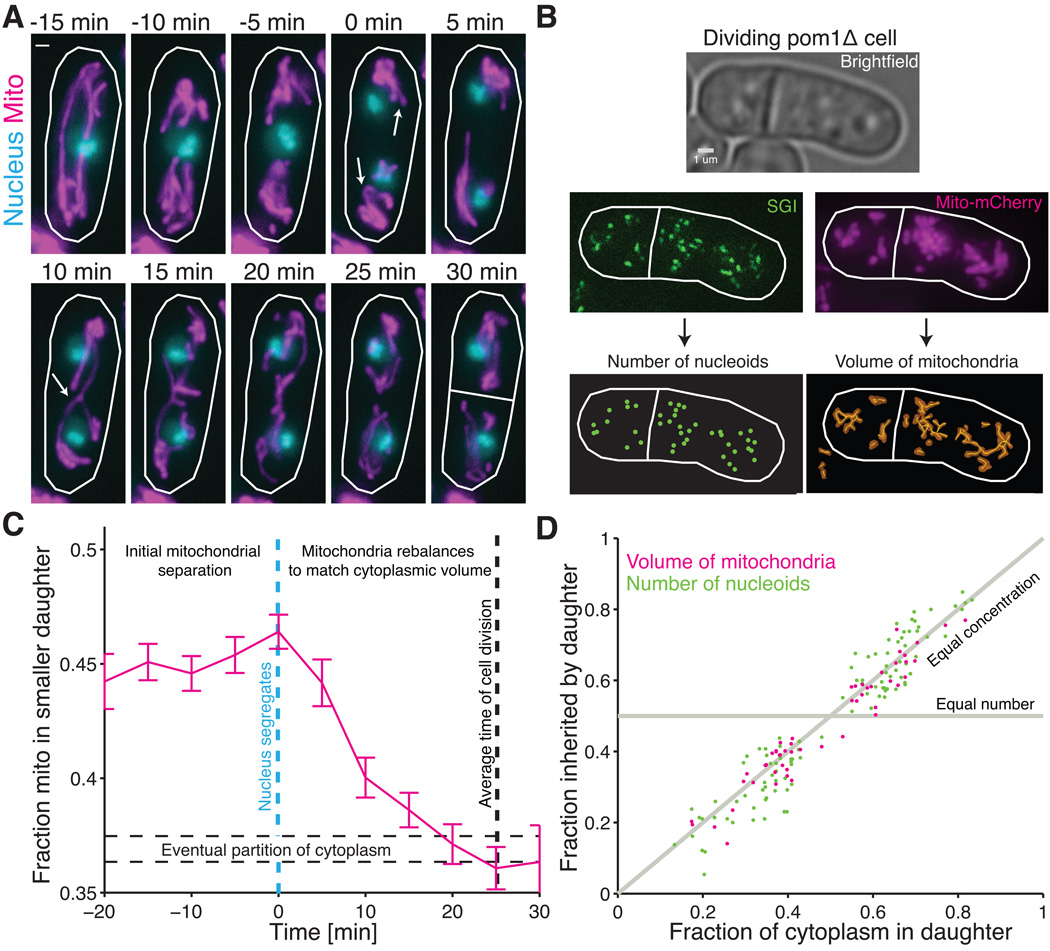
Spatial re-equilibration of mitochondria and nucleoids after nuclear segregation matches cytoplasmic division. (A) Timelapse images of a dividing wild-type cell (RJP041) with mitochondrial matrix-targeted mCherry (magenta) and green fluorescent protein (GFP) labeled nuclei (cyan). Arrows at 0 min indicate initial separation of nuclei and further bunching of the mitochondria to the poles and then reformation of a continuous mitochondrial network at 10 min but before division at 30 min. (B) For individual dividing pom1Δ cells (RJP025), the number of nucleoids in each daughter cell was determined with semi-automated spot detection of SGI signal, and the mitochondrial volume in each cell half was determined using the surface-based volume reconstruction from the MitoGraph software package (10). (C) Fraction of mitochondria in the part of the cell region that will eventually become the smaller daughter as a function of time for pom1Δ cells (RJP042). Images of cells as in (A) were taken every 5 minutes and aligned to when nuclei first separated (blue dashed line). Average cell division occurred 25 minutes after nuclear separation, with approximately 37% of cytoplasmic volume inherited by smaller daughter (dashed horizontal lines). Error bars indicate standard error of the mean (s.e.m.). Dashed horizontal lines represent the average partition of the cytoplasm ±1 s.e.m. (n=91 cells) (D) The fraction of nucleoids and of mitochondrial volume in each pom1Δ daughter cell as computed in (B), plotted as a function of the fraction of cytoplasmic volume in each daughter cell. The coefficient of determination between cytoplasmic volume and nucleoids is r2=0.88 (102 cells) and for cytoplasmic volume and mitochondrial volume is r2=0.88 (52 cells). All scale bars indicate 1 um.

