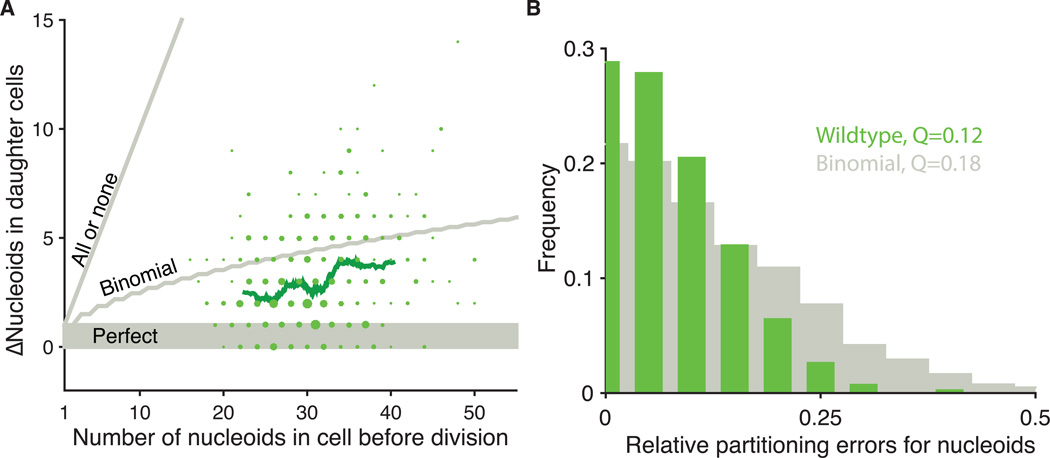
Figure 2.
Partitioning of mitochondria and nucleoids to daughter cells. (A) The absolute difference between the number of nucleoids segregated between wild-type sister cells plotted against the total number of nucleoids (RJP005 and DH60). The areas of plotted points are proportional to the number of observations. The green line represents a running average of 80 points. Gray lines indicate models of perfect, binomial and all-or-none segregation. 76% of cells segregate better than binomial, including 28% that are perfect. 24% segregate worse than binomial. Binomial predictions assumed that each nucleoid had the same chance of being inherited by either daughter (n=420 cells) More spot overlap in daughters with higher numbers can also reduce the observed error slightly, but appears to contribute marginally since we observe even more strongly sub-binomial errors in cells where each daughter gets as few as 10 copies. (B) The same data as (A) plotted as histogram of relative errors for nucleoid segregation compared to a binomial model. Q is defined as: where L and R are the number of nucleoids that partition to the left and right daughter cells respectively, and the angle brackets represent averages over all cells (22).

