Figure 4.
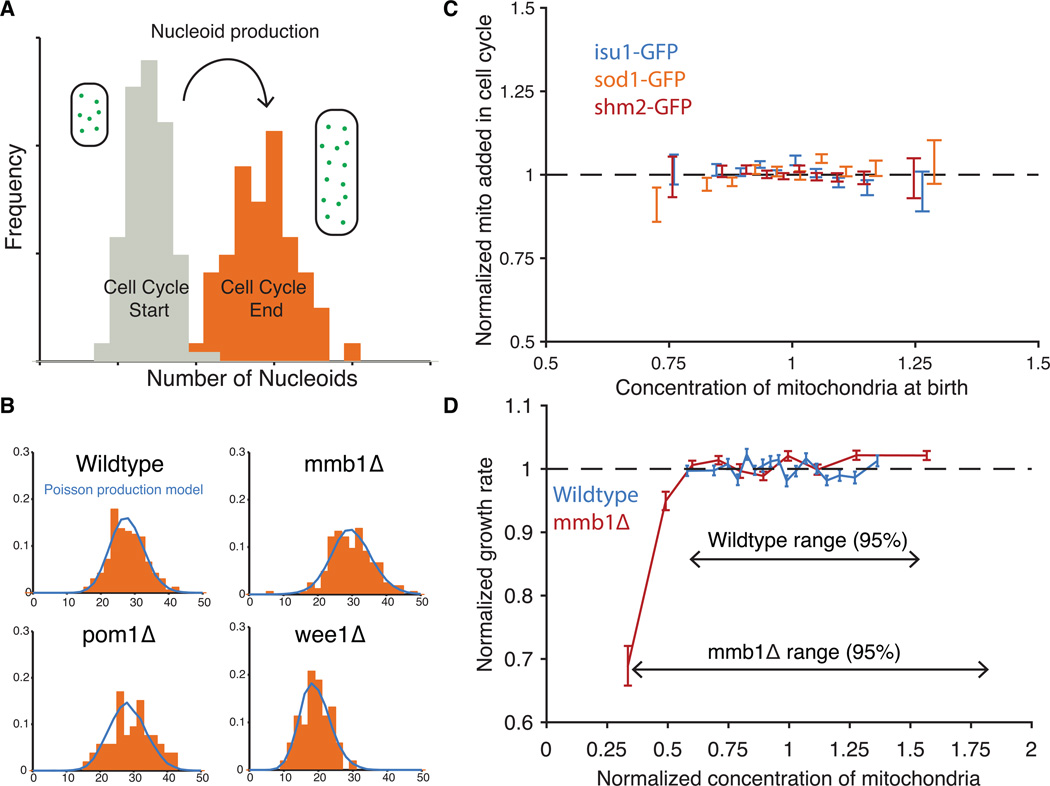
Nucleoid and mitochondrial production is constant and cell growth depends on mitochondrial concentration. (A) Schematic of data used to infer nucleoid production. In dividing cells, the number of nucleoids was measured for both newborn daughter cells (grey) and just divided mother cells (orange) and then normalized to the average volume of each population. (B) To model nucleoid production without feedback control, a Poisson distribution based on the average number of nucleoids at the beginning of the cell cycle was added to the full distribution of nucleoids at the beginning of the cell cycle. The resulting distribution is plotted in blue against the actual data from the end of the cell cycle (orange) for each strain. On average over all datasets and strains, the standard deviation predicted by the Poisson model differed from the actual data by 15%. (C) Total mitochondria added during the cell cycle divided by the added volume is plotted against the concentration of mitochondria in newborn cells. Both are normalized by their respective averages. The fluorescence signals of mitochondrially-localized GFP fusion proteins were used as a proxy of the amount of mitochondria in the cell. A running average of data is shown with error bars representing the s.e.m. of the observations. (isu1-GFP: n=835 cells, sod1-GFP:n= 1167 cells, shm2-GFP: n= 2720 cells (D) The normalized growth rate of cells is plotted against the normalized concentration of mitochondria for both WT (n=3582 cells) and mmb1Δ (n=2056 cells). Each point is an average of 200 cells and error bars are ±1 s.e.m.

