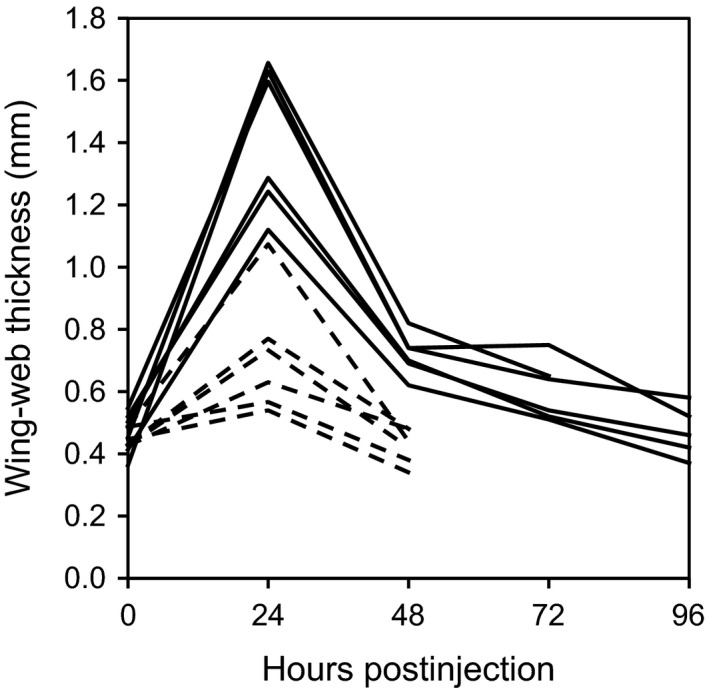
Figure 2.

Individual variation in wing‐web thickness prior to injection with phytohaemagglutinin (0 h postinjection) and on subsequent days following injection. Plotted are individual reaction norms for 12 nestlings from two broods (solid and dashed lines represent nestlings in different broods).
