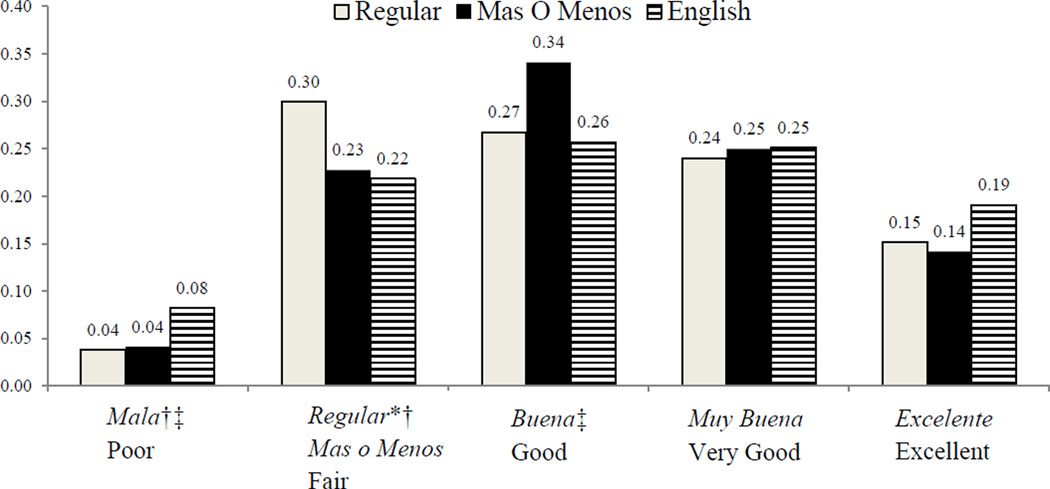
Figure 2. Adjusted Predicted Probabilities of Multinomial Logistic Regression Model of Self-Rated Health for Latinos by Language of Interview: Latino Decisions/ImpreMedia Survey 2011 (n=1,086).
Note. Controlling for age, gender, education, income, citizenship, insurance coverage, Mexican origin and financial stability (all of which were set to their mean or mode values).
*P < 0.05 for the difference between Spanish-“Regular” and Spanish-“Mas o Menos-” language interviewees in the same response category, † P < 0.05 for the difference between English- and Spanish-“Regular” language interviewees in the same response category, ‡P < 0.05 for the difference between English- and Spanish-“Mas O Menos” language interviewees in the same response category.

