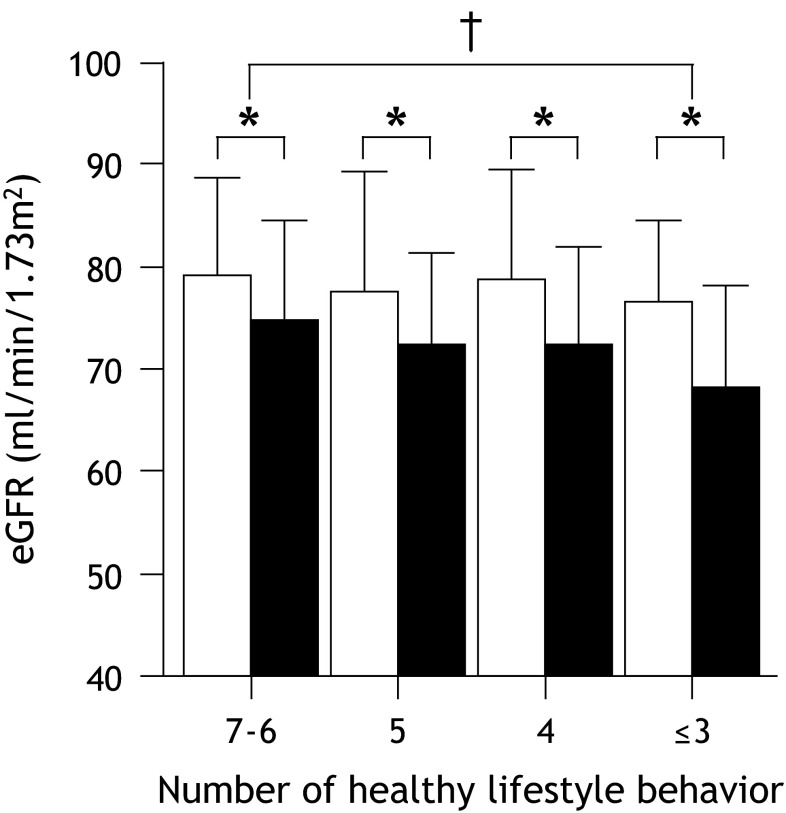
Fig. 3.
Comparisons of the eGFR at baseline and after the 5-year follow-up period among the four lifestyle behavior groups. The data are expressed as the mean ± SD. Open square baseline, filled square after 5 years. *p < 0.0001, compared to the values at baseline and after the 5 years in each group. † p < 0.05, a significant interaction effect for group × time

