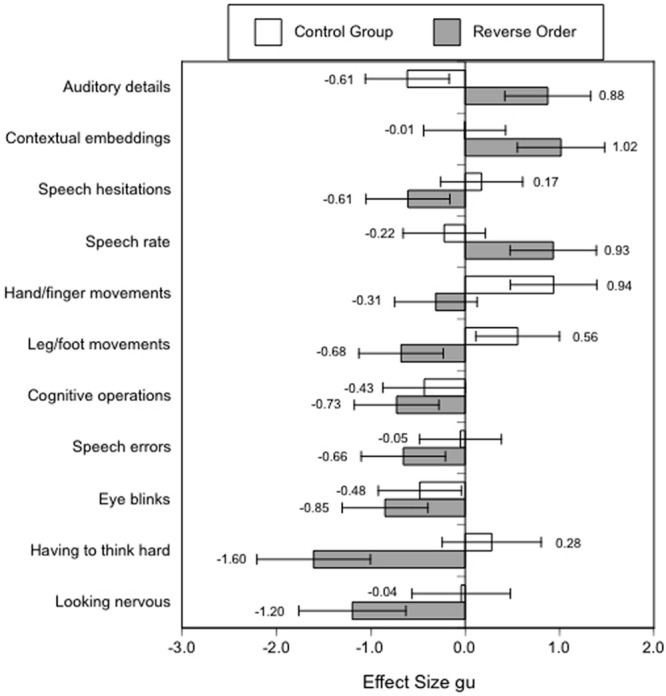
FIGURE 1.

Effect sizes gu [95% CIs] for nonverbal, paraverbal, and content cues to deception in the reverse order and control group of Vrij et al.’s (2008) study. Positive values indicate an increase in truthful statements, negative values an increase in lies.
