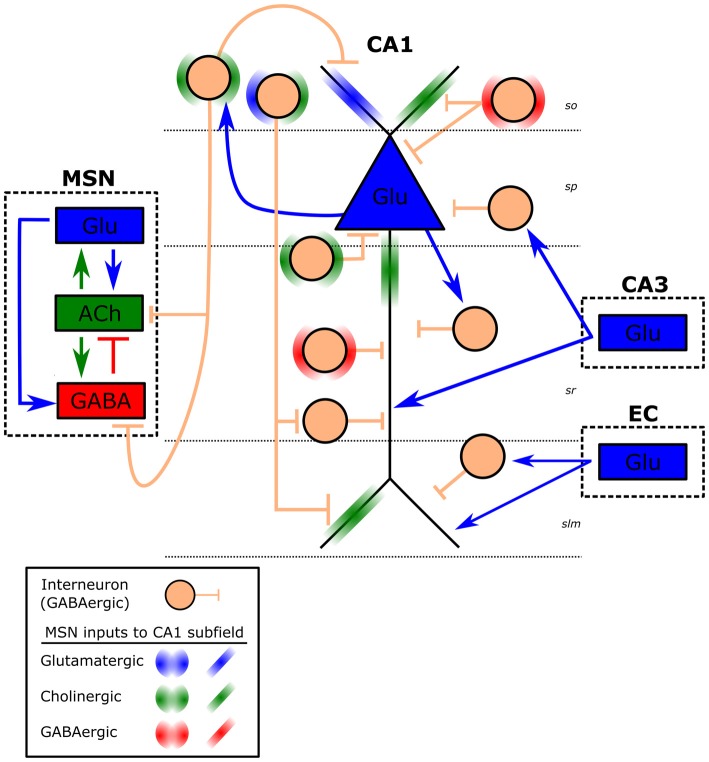
Figure 1.
Schematic of CA1 theta generators. Illustrated is a CA1 pyramidal cell (blue triangle) and hippocampal GABAergic interneurons (peach circle) within each CA1 layer. Approximate CA1 layers are indicated by dashed horizontal lines (so, stratum oriens; sp, stratum pyramidale; sr, stratum radiatum; slm, stratum lacunosum-moleculare). Interneurons within each layer represent a subclass of interneurons (e.g., O-LM, PV basket, axo-axonic) for that layer, which receive different inputs and have distinct projections (e.g., back projecting). Dashed boxes represent CA1 inputs from medial septal nucleus (MSN), entorhinal cortex (EC) and the CA3 subfield. Arrows represent excitatory (blue-Glu: glutamate, green: ACh- acetylcholine), whereas short vertical lines are inhibitory (red and peach: GABA) connections. Projections from the MSN are left out for clarity and are represented by halos (circular on interneurons, linear on CA1 pyramidal cell).

