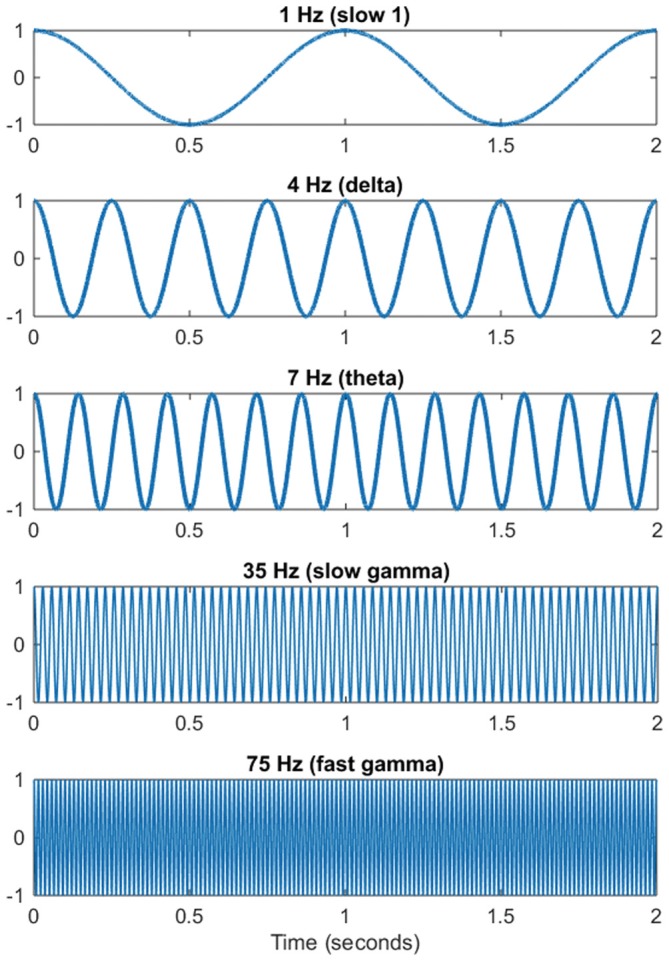
Figure 2.

Oscillations of varying frequency. MATLAB generated sine curves to represent neuronal oscillations that make up the unfiltered electroencephalogram (EEG). Each panel represents a distinct frequency and in parentheses the corresponding oscillatory band name most often associated with it.
