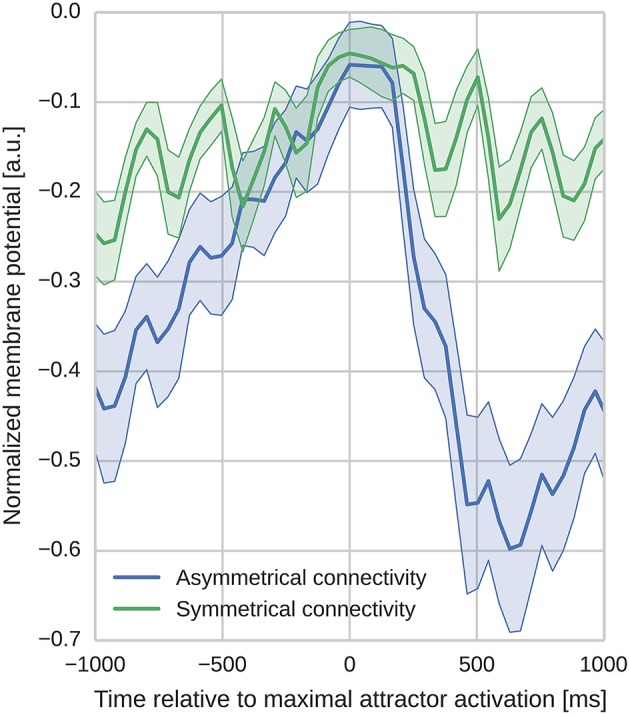
Figure 6.

Aligned average membrane potentials during sequence replay for two different connectivities. The membrane potentials have been recorded from all neurons in the trained network during sequence replay. These membrane voltages have then been averaged and aligned to the time of peak activity in the temporal domain (bold lines represent the mean, shaded areas represent the standard deviation). The y-axis has been normalized to improve visibility (0 corresponds to Vt and −1 corresponds to the minimal membrane voltage in the sample). In the network with asymmetric connectivity the mean membrane response shows a pronounced drop after the peak response, whereas the network with symmetric connectivity does not. Oscillatory behavior originates from switches between discrete attractor states alternated by phases of inhibitory feedback.
