
Figure-16.
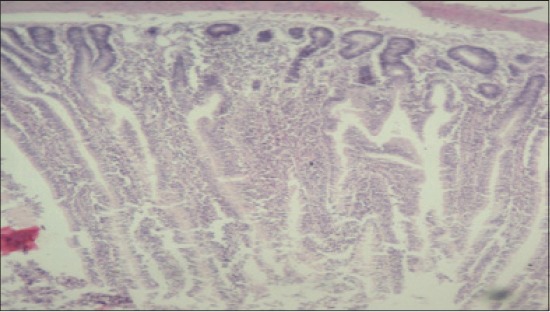
Jejunum from T7 showing normal villus architecture with increase in thickness and height of villus, occasional areas of cellular infiltration compared to control group (H and E, ×2.5).
Official websites use .gov
A
.gov website belongs to an official
government organization in the United States.
Secure .gov websites use HTTPS
A lock (
) or https:// means you've safely
connected to the .gov website. Share sensitive
information only on official, secure websites.
Jejunum from T7 showing normal villus architecture with increase in thickness and height of villus, occasional areas of cellular infiltration compared to control group (H and E, ×2.5).