
Figure 9.
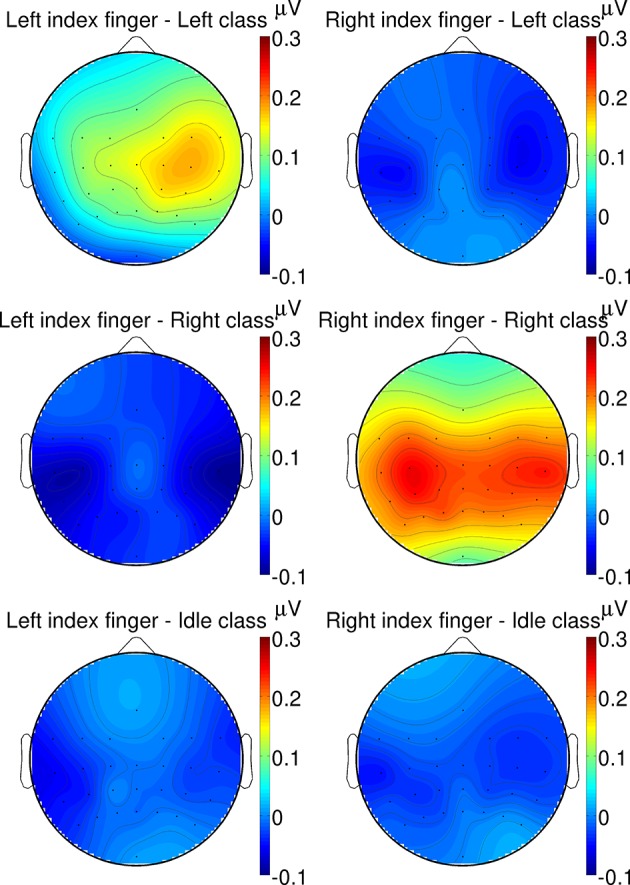
Grand average topographic plots of the P300 response. The spatial distribution of the P300 component extracted from a 200–500 ms time window is shown for different twitch locations (left/right column: left/right hand) and target classes (from top to bottom: left/right/idle cue).