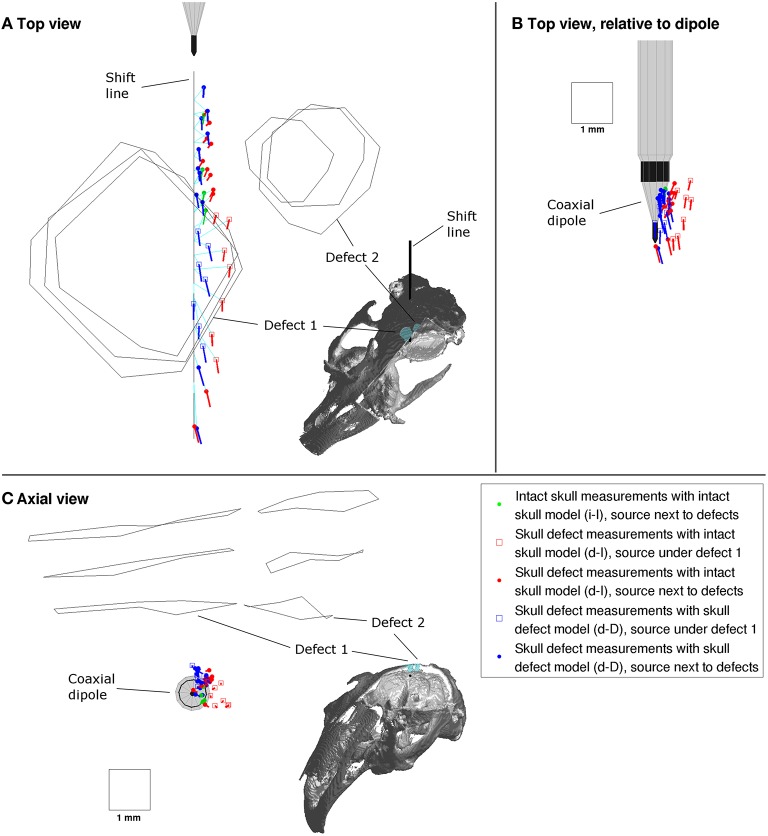
Figure 5.
Top (A,B) and axial view (C) of sources reconstructed from the successive MEG recordings along the shift line (black line). The inset images show the respective spatial view direction using the rabbit skull compartments, which are cut open to expose the inside of the skull. The dipole orientation line length is proportional to the source strength (1 mm = 300 μAmm). Sources reconstructed in i-I configuration in green, d-I configuration in red and d-D configuration in blue. Turquoise lines indicate mapping of equivalent to physical source position.

