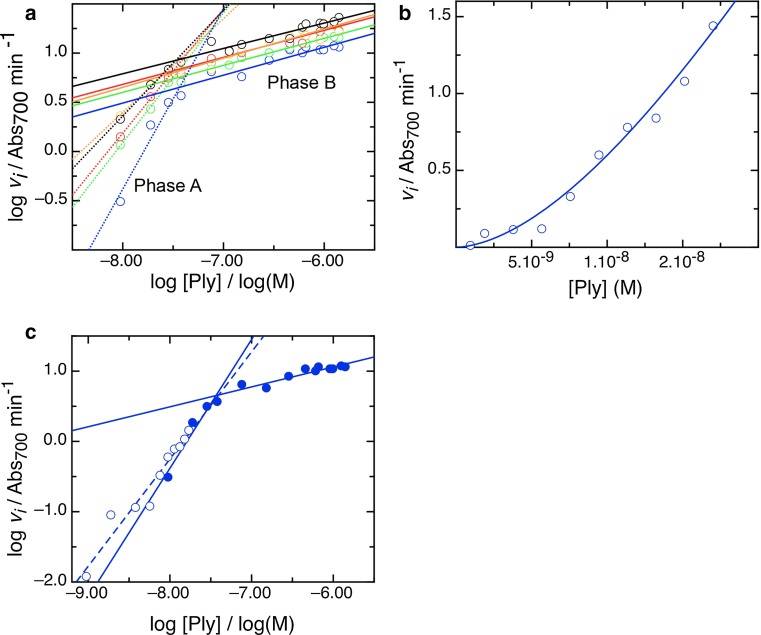
Fig. 3.
Rate of lysis displays two kinds of concentration dependence, and at lower pneumolysin concentrations is cooperative. a Dependence of rate, v i, on concentration at a range of temperatures, displayed by plotting logarithms to calculate the order of the reaction. As in Fig. 2, 30 °C data are colored blue, 33 °C green, 35 °C red, 37 °C orange, and 38.5 °C black. A dotted line fits rate order phase A, a solid line rate order phase b, and their gradients give the actual orders of the reaction. b Measurement of v i over the lower concentration range (rate phase A), at 30 °C, to pick out the cooperative kinetics in rate phase A. Hill coefficient, h = 1.7. c Logarithmic plot of the data shown in b demonstrating it is within rate phase A

