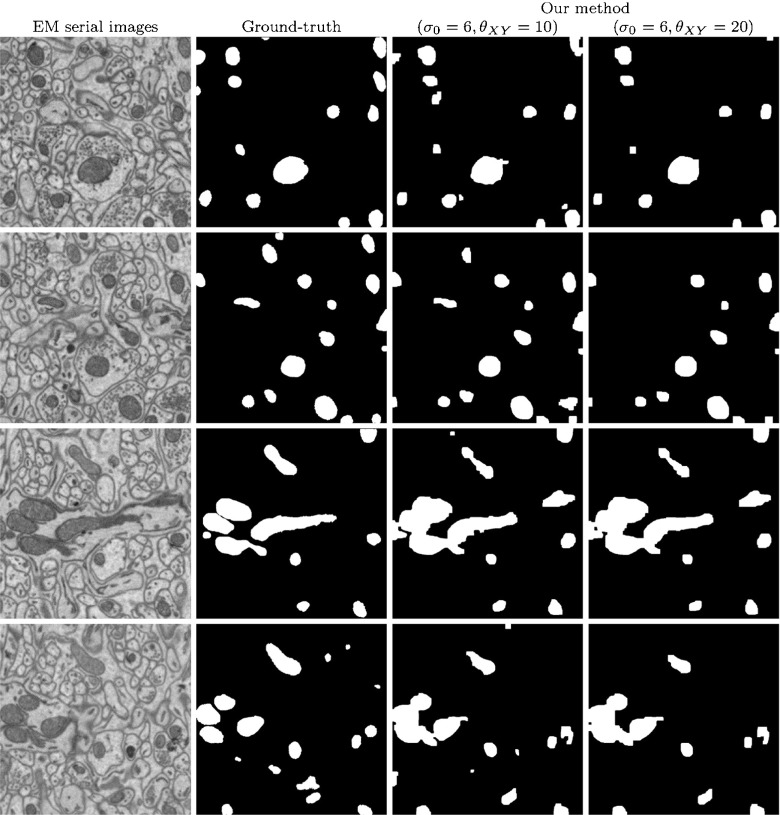
Fig. 10.
Segmentation of mitochondria in a 700×700×50 stack of EM serial images. The left column shows four individual, non-consecutive images from the stack. The second column shows ground truth data, manually segmented by an expert. The two rightmost columns show the results obtained with our algorithm using a base scale σ 0 = 6 and two different sets of regularization parameters θ XY and θ Z.

