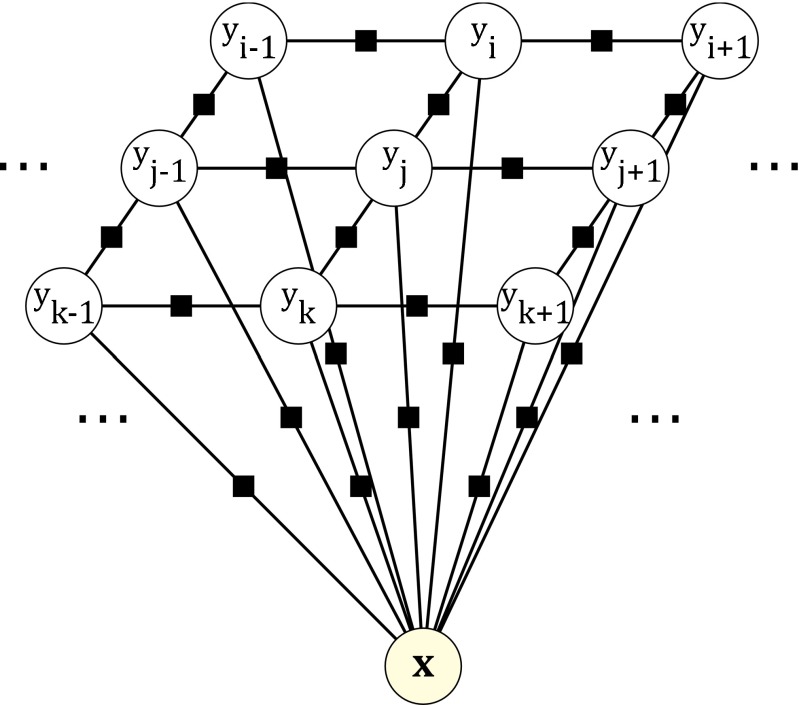
Fig. 4.
Factor graph for the CRF. The random variables are inside circle nodes. Black squares represent potentials depending on the random variables they are connected to. The energy of the CRF is the sum of all potentials. This figure shows only a fragment of a 2D CRF, but the generalization to 3D is straightforward

