Figure 1.

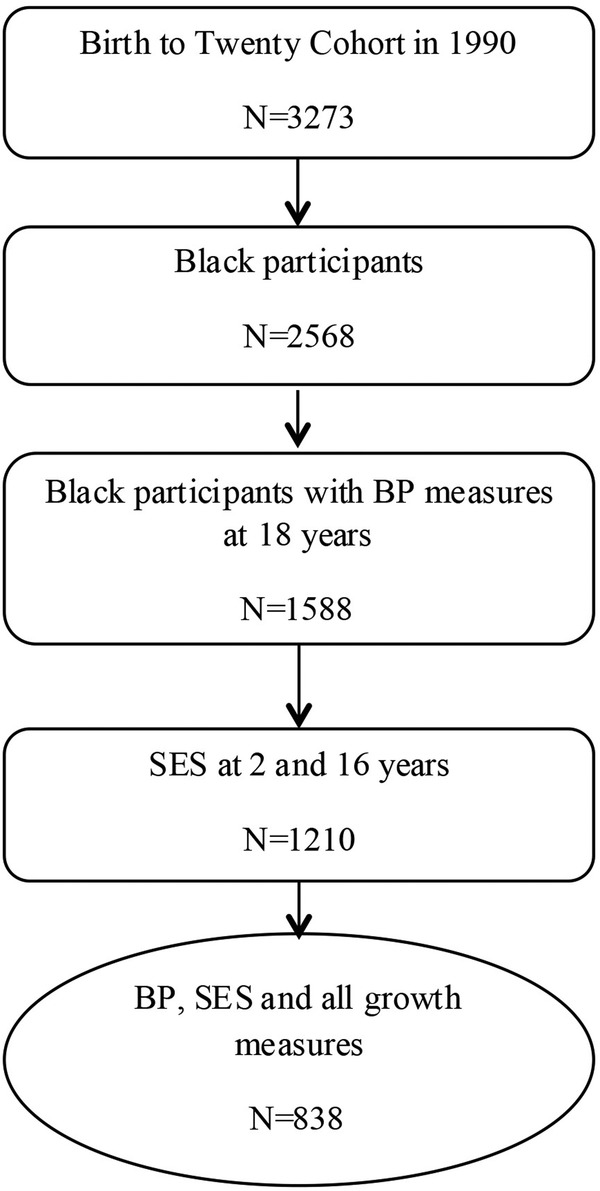
Flow chart of the study population with SES, growth and blood pressure at the age of 18 years. BP, blood pressure; SES, socioeconomic status.

Flow chart of the study population with SES, growth and blood pressure at the age of 18 years. BP, blood pressure; SES, socioeconomic status.