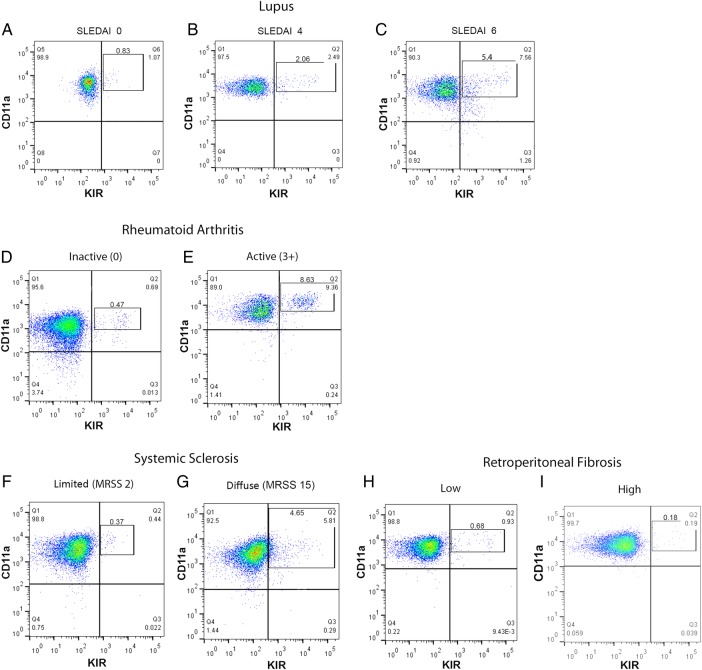
Figure 3.
CD3+CD4+CD28+CD11ahiKIR+ T cells in patients with rheumatic autoimmune diseases. The selected examples are representative of 4–7 patients for each level of disease activity. (A) Inactive systemic lupus erythematosus (systemic lupus erythematosus disease activity index (SLEDAI) 0–2, n=6). (B) Mildly active lupus (SLEDAI 4–5, n=7). (C) Active lupus (SLEDAI ≥6 , n=6). (D) Inactive rheumatoid arthritis (RA) (n=5). (E) Active RA (n=4). (F) Diffuse/limited systemic sclerosis (n=4). (G) Diffuse systemic sclerosis (n=8). Retroperitoneal fibrosis (n=8) served as a control. Disease activity was clinically determined as described in the ‘Methods’. Gating was established based on single antibody and full minus one controls for each experiment. The rectangles indicate KIR+ cells selected in quadrant 2. Numbers above the rectangles are the per cent of total cells. MRSS, modified Rodnan skin score.

