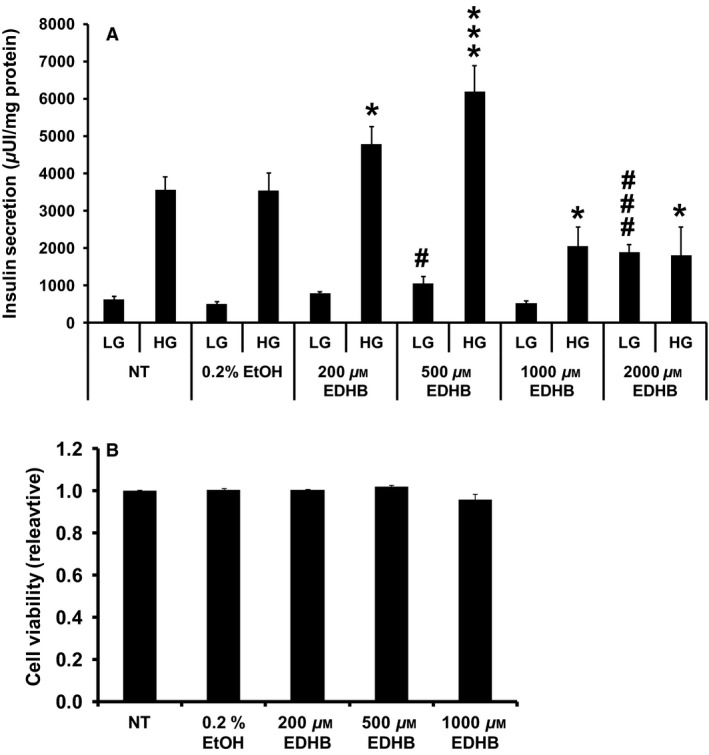
Figure 1.

EDHB inhibits GSIS from 832/13 cells. (A) Effects of EDHB on GSIS from 832/13 cells (n = 8–12). (B) Relative cell viability. Results represent mean ± SEM. LG, low glucose (2 mmol/L); HG, high glucose (10 mmol/L). #P < 0.05, ###P < 0.001 for LG NT versus LG EDHB. *P < 0.05, ***P < 0.001 for HG NT versus HG EDHB. 0.2% ethanol was chosen as a control as it was the maximal amount of solvent used at the highest dose of EDHB. NT, no treatment.
