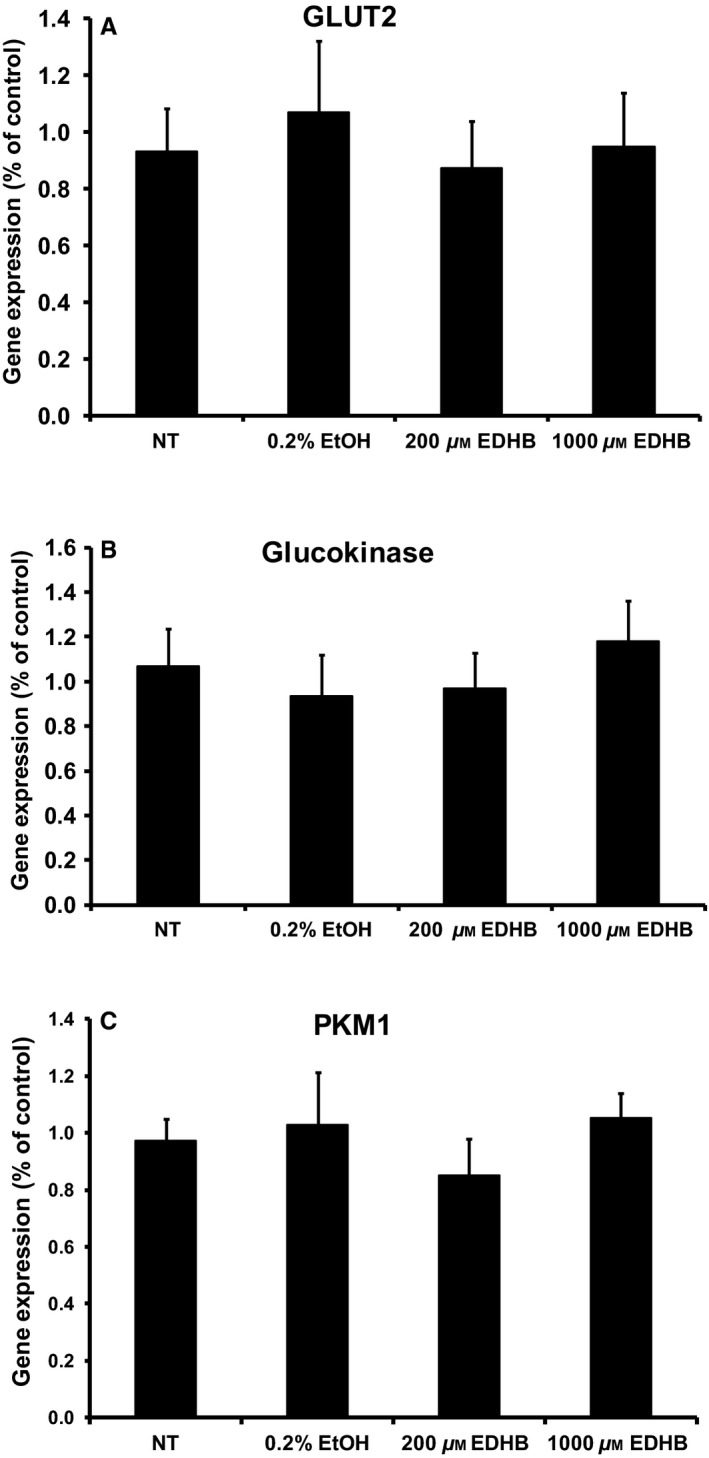
Figure 8.

Effects of EDHB on gene expression in 832/13 cells. mRNA expression of (A) glucose transporter 2 (Glut2), (B) glucokinase, (C) pyruvate kinase muscle isozyme 1 (PKM1) (n = 6–8). Gene expression was corrected for by an internal control gene (cyclophilin) and then expressed as percent of control.
